Examining the Singleness Gender Gap in the Pew Survey
Is this large discrepancy in singleness between young men and women real? Is it caused by Chad stealing the women away? Is a high singleness rate among young men new?
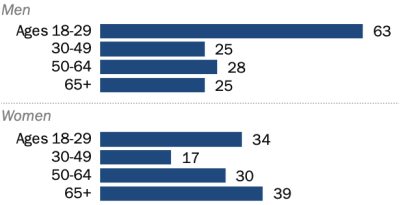
A statistic which has had an enormous impact and become another staple in the ‘male loneliness epidemic’ discourse comes from a Pew survey which showed that while 34% of young women reported not being currently in a committed relationship, 63% of young men did—almost twice as many.
This unsurprisingly blew up on social media and triggered a slew of alarmist articles.
In the 2019 Pew survey, 51% of young men and 32% of women reported being single. This means that while there was a 12% rise in singleness among men, there was only a 2% rise among women, for a 10% wider gap. “Who are all the young women dating?”, everyone wondered. Almost two years later, people are still trying to figure this out, and it remains a frequent source of debate.
How consistent is this finding?
It’s always advisable to attempt to cross-reference with other sources to get as accurate a picture as possible. Are these seemingly extraordinary findings corroborated by other surveys?
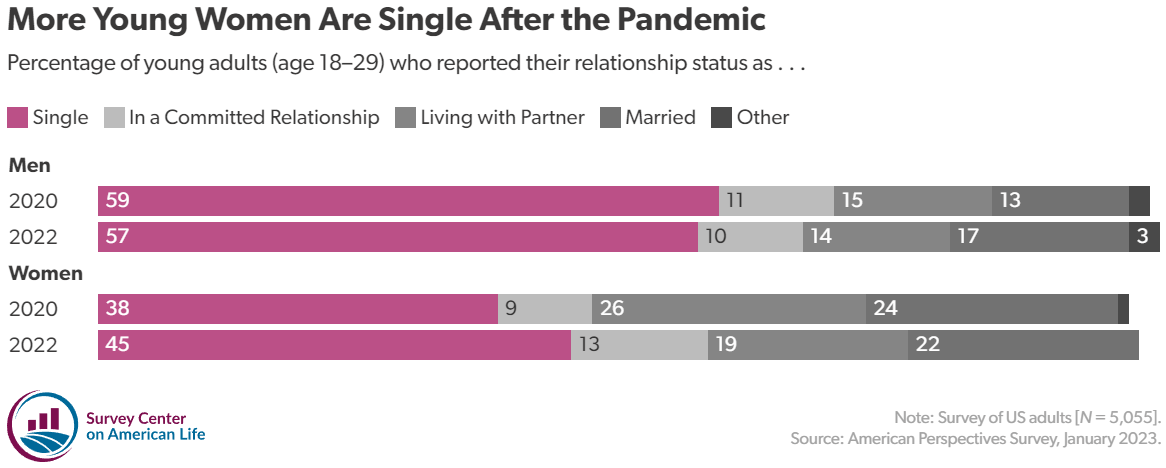
The American Perspectives Survey found that contrary to the gap widening, it was reduced from 21% in 2020 to 12% in 2022, with 2% less young men and 7% more young women reporting being single.
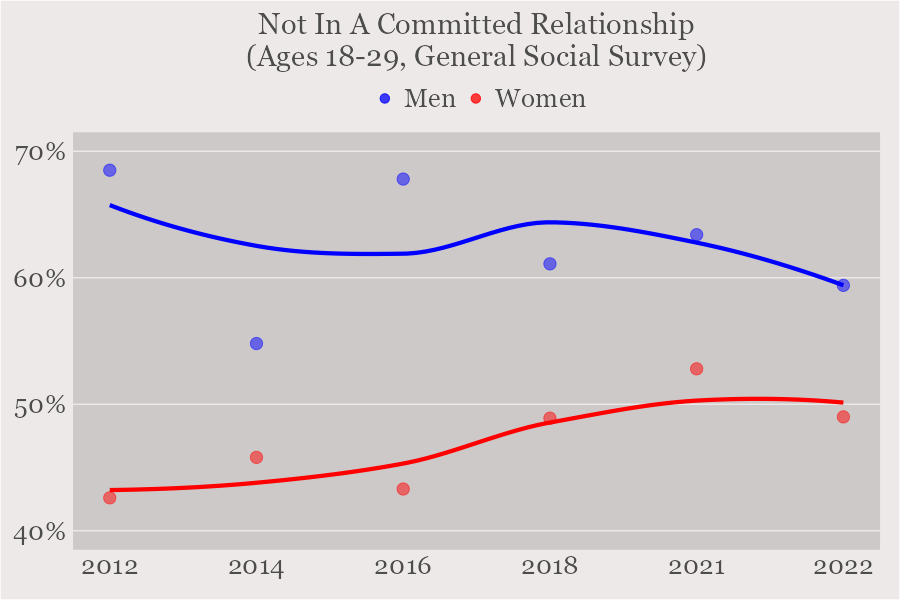
The General Social Survey in the last two surveys in 2021 and 2022 has shown a gap of around 10% between young men and women, and likewise shows no sign of a widening gap.
While the Pew and APS surveys employed online panels, the GSS uses random cluster sampling. There may be a selection bias in the people who join and participate in online panels which make them more likely to be in relationships (Bojak et al., 2013; Tsuboi et al., 2015), and which may explain why there are generally more single people in the GSS samples.
The sample sizes between the surveys are relatively comparable. In the Pew survey, there were 330 men and 553 women aged 18-29; in the APS, 298 men and 281 women, in the 2022 GSS, 267 men and 337 women; and in the 2021 GSS, 200 men and 261 women. While the Pew sample size is the largest individually, the combined GSS sample size would surpass the Pew survey. It’s worth mentioning that there was an oversample of LGB in the Pew sample too, though this shouldn’t in itself compromise the results after weighting the data.
The fact that other sources show significantly smaller gaps along with the fact that online panels, even if initially recruited through probability sampling, may be less representative of the general population than actual probability samples, is good reason to be skeptical of the Pew results.
The Chad of the gaps
The manosphere was highly enthusiastic about this finding as it was of course taken as validating the chadspiracy theory whereby ‘chads’ are forming ‘soft harems’, leading to a situation of ‘de facto polygamy’ under which the majority of men are excluded from the dating market.
The narrative which has developed around this Pew finding suggests that women are unwittingly ‘sharing chad’ while under the false impression that he’s committed to them alone.
We do have a prominent example of this ‘plate spinning’ in the recently exposed Andrew Huberman, but is this really such a widespread phenomenon? It seems especially hard to believe in a world where everything is broadcast to social media. Let’s not forget that Huberman is a neuroscientist, either.
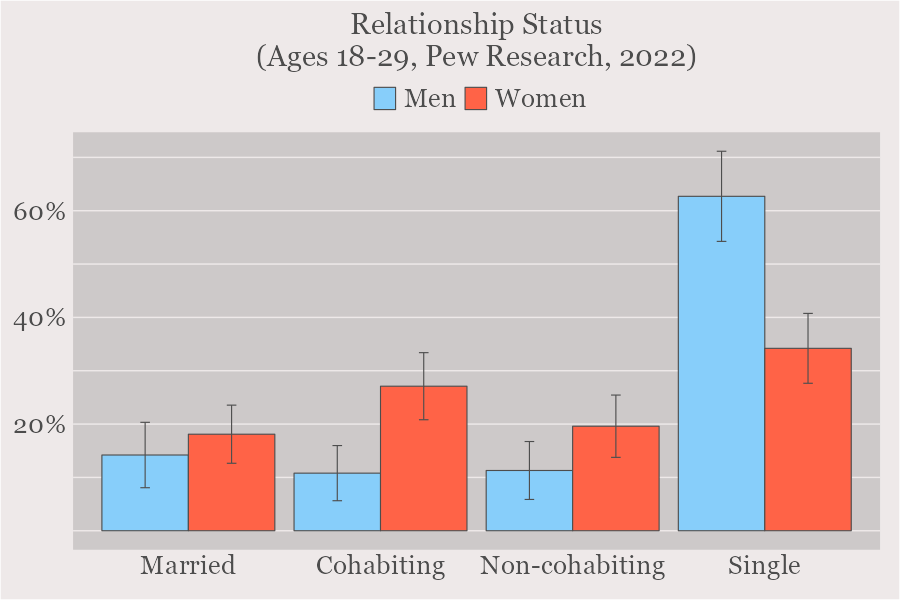
Luckily there is a way that we can put this theory to the test. In the Pew report, people were simply split into ‘in a committed relationship’ and ‘single’. However, ‘committed relationship’ can refer to multiple different arrangements. The options in these surveys are married, cohabiting, or a more vague ‘committed relationship’. The chad harem hypothesis would of course predict a disproportionate number of women selecting the third option which is the only one which allows for the secrecy required for it to function.
You may have noticed that the APS broke the results down by relationship category. The singleness gap in these surveys appears to have been caused primarily by more young women than men reporting to be married or cohabiting: in 2020, 2% more men were in a non-marital and non-cohabiting relationship, while 11% more women were cohabiting and 11% more women were married. In 2022, 4% more women were in a non-marital and non-cohabiting relationship, 5% more women were cohabiting, and 5% more women were married.
The 2022 APS also included ‘casually dating more than one person’ as an option for single people’s dating status. Overall, 1.3% of 18-29 men and women were both single and selected this, so unless these ‘soft harems’ rival those of Chinese Emperors…
The same organization, the Survey Center on American Life, conducted another survey in 2021 using a different panel. This one included 384 18-29 men, more than Pew, and 461 18-29 women. 86% of the 15.4% gap was caused by a surplus of married or cohabiting women. Another survey from the same year shows no gap in the non-cohabiting category.


I also downloaded the raw data from Pew to see if the same thing applies there. For the most part, yes: 71% of the gap is caused by a surplus of married and cohabiting women.
The final survey I’ll cover is the National Health Interview Survey, a large, nationally representative probability-based survey. The sample size dwarfs that of the others here, but an unfortunate drawback is that it lacks an option for non-marital/non-cohabiting relationships. Nonetheless, it could still provide more reliable marriage and cohabitation rates for comparative purposes.
What we find is that between 2020 and 2023, the overall gap in these categories ranges from 8-11%, which is in stark contrast to the Pew gap of 20%, providing strong evidence of its falsity. Moreover, while the percentage of women cohabiting or married was between 35-38%. It would require an implausibly high number of women in non-cohabiting relationships to reach the 66% of women in relationships reported by the Pew survey, meaning that the GSS estimate of 50% is probably about right.
Is this really a new phenomenon?
When this is brought up, the implication tends to be that most young men being single is some crazy unprecedented scenario. What if we take a look at some older data though, were things really drastically different in the past?
In a 2005 Pew survey, half of young men and 32% of young women were single. There was about a 13% gap in being married, and 4% in ‘living as married’, which must have meant a legal civil union since so few selected it.
The four GSS surveys which asked about relationship status (rather than just marital status) prior to 2012 show young male singleness rates fluctuating between 46% and 63%, with an average gender disparity of 16.5%. Even close to 40 years ago, ‘most young men were single’, while ‘most young women were not’.
Using US Census data from 1900 I found that 50.7% of young women compared to 30.5% of young men were married. Taking a trip back to 1950 America where I hear you were guaranteed a hot barefoot housewife after turning 18, even here we see that actually about half of young men were unmarried (which at this time effectively means single; premarital cohabitation didn’t begin picking up until the 70s).
The average gap in median marriage age was only slightly higher in the 50s, so it shows how sizeable gaps in singleness are possible even with modest average age gaps.
Another survey from the Survey Center on American Life found that fewer Gen Z’ers had dated during their teens than prior generations. While 56% of Gen Z’ers had, 66% of Millenials, 76% of Gen X’ers, and 78% of Boomers had done. There doesn’t actually seem to be evidence that this is a gendered however, as 54% of Gen Z’er men had, meaning that for Gen Z women the percentage would be only around 4% higher. Not only would this difference fail to reach statistical significance, but it could easily be explained not just by females dating older males but even by the slight male surplus that exists among young adults could explain most of it. Moreover, if 18–19 year olds were included in the sample, then this would presumably leave some time remaining for Gen Z’ers to go on their first dates during their ‘teen years’, so there is a chance this may be slightly misleading.
Are these men seeking relationships?
Should we assume that all single men are desperate to find a romantic partner but are ‘insing’, or are a good chunk actually MGTOWs (men going their own way) or otherwise not looking to date?
A graph produced by Pew showed that 50% of single men reported being uninterested in dating, up from 39% in 2019, while the rate for women remained similar at 65%. This included all ages, however. If we instead look at the percentages for young men and women, they drop to 41% for men and way down to 36% for women, so older single women were substantially driving up the percentage.
These figures are quite close to those seen in the 2019 survey where 35.4% of young single men and 39.3% of young single women reported being uninterested in dating, and the difference doesn’t appear to be statistically significant. In the 2005 Pew survey, 38% of 18-29 singles were uninterested in dating. So it doesn’t seem like there’s a strong trend here either.
We also have to remember that a lot more young men reported being single, so more young women’s desires to be in a relationship were being fulfilled. If we instead look at how many young men and women were both single and uninterested in dating from the overall sample, we come to 26% of men and 12% of women.
Among young singles in the 2022 APS, 34% of men and 43% of women reported being uninterested in dating, amounting to 19.7% of young men and 19.4% of young women overall.
48% of single men and 61% of single women stated enjoying being single more as a minor or major reason for being single. 17% of men and 24% of women stated it was a major reason. Difficult to meet people, more important priorities, people don’t meet expectations, and other’s aren’t interested were other common reasons selected by both men and women. Some weren’t ready after a break-up.
So going by these figures at least, there are a substantial number of men who aren’t looking to date at all. It’s difficult to say though how many are for ‘MGTOW’ related reasons such as feeling that ‘the juice isn’t worth the squeeze’. Some people would assert that many of these men saying they’re uninterested in dating are just ‘coping’ by framing it as a deliberate choice when in reality they’re without options, but we won’t speculate here.
Conclusion
Firstly, we found that the young singleness gender gap in other surveys was significantly lower than that seen in the Pew survey. While a young male singleness rate of around 60% seems reasonably accurate, the young female singleness rate seems like it’s significant underestimated in the Pew survey. This is a reminder that we shouldn’t take the results of a single survey as gospel truth. There is nothing about this survey that makes it superior to the others in any meaningful way. If anything there is an inverse correlation between a statistic’s accuracy and its virality. If it’s headline grabbing and fits a popular narrative it won’t take long to spread to every corner of the internet and become an incontrovertible truth which shows up in virtually every discussion around the pertinent topic while more ‘boring’ data lingers in obscurity.
Secondly, the bulk of the gap is a result of more women than men reporting being married or living with their partners. Unless chads (and women) are converting to Mormonism at record numbers, polygamy doesn’t seem like a likely explanation. It’s not easy to get reliable figures on the prevalence of polyamory—especially since it’s often lumped together with other forms of consensual non-monogamy such as open relationships, but from the data that is available it still seems quite rare, and also not practiced more by women than men (contrary to the notion that it represents a form of de facto polygyny). This leaves little room for sneaky chad ninjas to spin their plates, as the only category under which this is at all feasible is the more amorphous non-marital and non-cohabiting relationship.
Thirdly, there is nothing new about a large portion of young men being single. You could’ve probably written the same headline that ‘Most young men are single. Most young women are not’ throughout most of the past century and who knows how far further back. There may be a good number of young guys who struggle to land a date, but if this wasn’t an urgent crisis 10, 25, 50, or 100 years ago, it’s hard to see what should suddenly make it one now.
There is also little evidence for a widening gender gap, which would indeed be tricky to explain. Another overlooked shift appears to be that 10% less 65+ women reported being single in the 2022 Pew survey, yet 4% more 65+ men did, for a 14% narrower gap. If you assume that the 18-29 shift is real you also have to explain this peculiar change. Who are these grannies shacking up with all of a sudden? More likely is that both are simply meaningless fluctuations.
Finally, a good number of men say they aren’t too eager to begin a relationship, whether it’s because they’re too busy on the grind, have foregone real women for AI gfs and onlyfans, just want to date casually before deciding to settle down, etc. It’s not clear how much of a change this really is though. How actively the they are searching is another question; it could be that dating apps are having the effect of creating complacency.
So how about the gap that does exist? It’s possible that if so-called ‘situationships’ are on the rise there could be more disagreement between men and women as to whether or not their situation constitutes a ‘committed relationship’, though again at most a small portion of the gap exists in the relevant category.
What can arguably be considered the ‘default hypothesis’—that the women are dating men outside the age bracket—is probably the best bet. A more realistic gap somewhere between 10-20% could reasonably be explained this way. In the NHIS, 42.1% of married 18-29 women were married to men above the age of 29, while 26.1% of cohabiting women were cohabiting with men above 29. For men on the other hand, 15.1% were married and 11.5% cohabiting with women above 29. The male surplus which exists in the younger demographic (there are about 105 men to every 100 women in the 18-29 age bracket) can also help close the gap by a few percentage points.
Women tend to state a preference for men around their own age to slightly older while men prefer progressively wider age gaps the older they get (Kenrick & Keefe, 1992). This is probably why age gaps have shrunk with time: men have less leverage in the dating market owing to women’s economic empowerment. It may also be the case that they emerge not solely from a direct preference for older men, but for example men who have higher social status.
It’s probably worth mentioning that in the GSS, the singleness gap among 30-49s was 5% smaller, while the gap among 50-64s was 8% larger, and 65s and up was 7% larger. This makes it that much easier to explain the gap among 18-29s. The reason we don’t see a reversal of the gap in the 30-49 age bracket is because of the countervailing effect of women in it also dating men from the above age bracket.
One last thing to mention is that, while it should go without saying, being currently single doesn’t mean was always or will be forever alone. In fact, a survey of 978 college students conducted in 2023 found that only 17% had never had a romantic partner before. Most men will have their day.
It might to some sound like a cop-out, but the reason why this gap seems so crazy and impossible to explain may simply be because it’s not actually that large in reality. Anomalous outcomes like this do happen, perhaps due to sampling bias, random error, or some combination, and when they do, they are the ones which attract the most eye balls and spark the most intense debate. It is certainly believable considering other trends that the youth are beginning to date later just as they are maturing later in other areas, but similar to various other trends, there doesn’t appear to be any evidence that this is a gendered phenomenon—at least numerically.
References
Bosnjak, M., Haas, I., Galesic, M., Kaczmirek, L., Bandilla, W., & Couper, M. P. (2013). Sample composition discrepancies in different stages of a probability-based online panel. Field Methods, 25(4), 339–360. https://doi.org/10.1177/1525822X12472951
Tsuboi, S., Yoshida, H., Ae, R., Kojo, T., Nakamura, Y., & Kitamura, K. (2015). Selection bias of Internet panel surveys: a comparison with a paper-based survey and national governmental statistics in Japan. Asia-Pacific journal of public health, 27(2), NP2390–NP2399. https://doi.org/10.1177/1010539512450610
Kenrick, D. T., & Keefe, R. C. (1992). Age preferences in mates reflect sex differences in human reproductive strategies. Behavioral and Brain Sciences, 15(1), 75–133. https://doi.org/10.1017/S0140525X00067595


I've read several of your articles now and I've noticed that there are often a lot of problems with these surveys. Could other stats like male labor force participation rate or male college attendance be more reliable? If so, why not look at them and infer conclusions from those in combination with other evidence? Perhaps it can avoid some of the difficulties of surveys like survey sizes, dishonest, or categorization issues?
Although I don't personally believe the chad hypothesis, I'm curious if it's necessary that "committed relationship" is the only viable category option to represent it. Couldn't a 'chad' be cohabitating or married to one woman while also spending a significant amount of time living at another person's house such that the 'side-woman' might call it cohabitation? Or, in a different scenario, I wonder, if we granted a chad hypothesis such that each chad had 1 marriage/cohabitation and 1 woman in committed relationship, what would that look like? If most of the gap is age-related, a chad hypothesis would only explain a relatively small portion of the gap at best, but maybe the point is about perception or relative increase than absolute numbers. If, in the minds of people, they see a large relative rise in chads having multiple women, could it have a cascading effect leading to other changes in data even if the absolute numbers of chads are small?
Edit: I wonder how much of the discrepancies between different surveys to each other & to people's perceptions is based on the different ways people categorize the same act. My intuition leads me to think that this plays a significant role which is why I suggested things like economic data and making inferences based on that.
Fascinating stuff. I wonder you can say or write something on stats reportedly showing that young women are far more Progressive than young men on something on the lines of a 80-20 split.