Sexual Activity and Singleness in the 2024 GSS
An analysis of the most recent GSS survey release focusing on sexual inactivity, singleness, and sexual partner numbers
The 2024 General Social Survey data is out, marking the third wave since the 2018 survey that spawned the Washington Post’s infamous ‘sex recession’ graph. We’ll begin with another update to that graph. Do the results align with this poorly photoshopped graph that went viral on X?
Sexlessness: Are incels so back?
When I first published this article, the dataset lacked the PARTNERS variable, leaving only SEXFREQ for sexual frequency. I assumed they’d just axed a bunch of questions, but the second release included PARTNERS (though still lacks other sexual questions).1
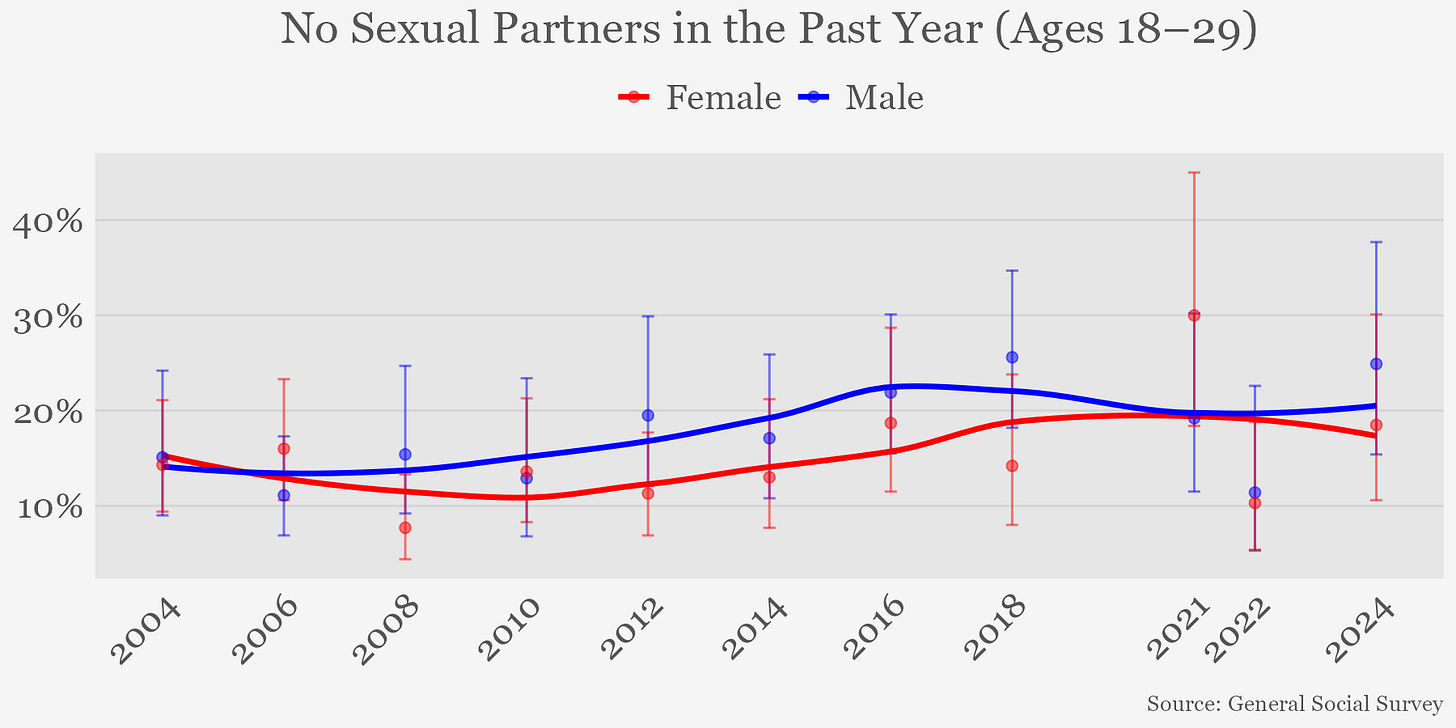
After a brief dip, the male sexual inactivity rate is back to where it stood in 2018, with 24.9% of men aged 18–29 reporting no sex in the past year, compared to 18.5% of women.2
Still no big singleness gap between young men and women
Contrary to the megaviral Pew survey that reported a 29% singleness gap among under-30s in 2022, the GSS has shown no evidence for a large or widening divide, consistent with other surveys. This remains true in 2024: 56% of men and 54% of women aged 18–29 reported being single—the smallest gap on record.34
Sexual partner distributions
Date Psychology, who covered the 2021 and 2022 GSS in How Many Sexual Partners Did Men and Women Have?, has been MIA for a while, so I will fill in this time around.
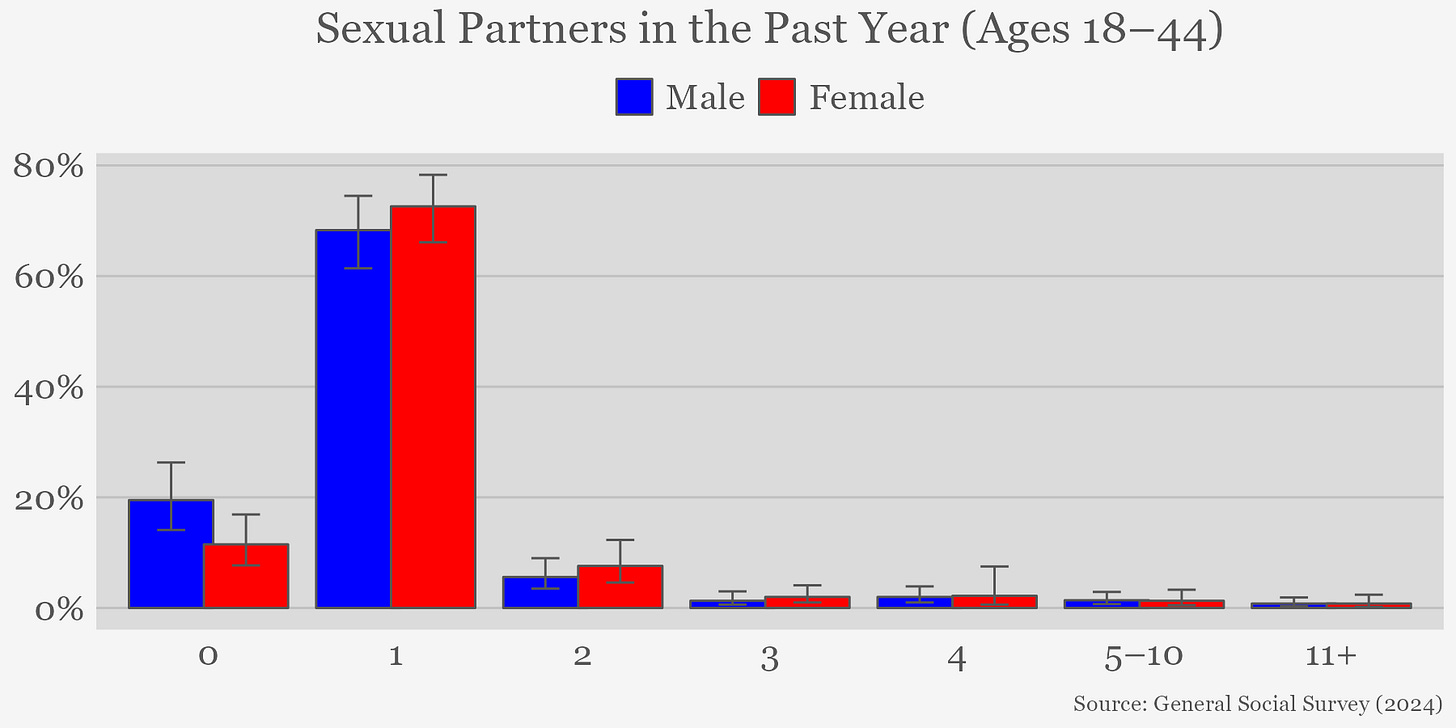
The main weakness of the survey is its mediocre sample size after stratification. Many people after seeing Date Psychology’s graphs say they don’t make sense, but they do when you understand the data limitation. To begin with something more robust, we’ll examine a wider age range of 18–44, including 373 men and 443 women.
Among this sample, 19.5% of men and 11.5% of women reported having no sex partners in the past year. Only 11.1% of men and 13.9% of women reported having more than one, and for three or more it was 5.5% and 6.3%, respectively. A chi-square test found no significant difference in distributions.5
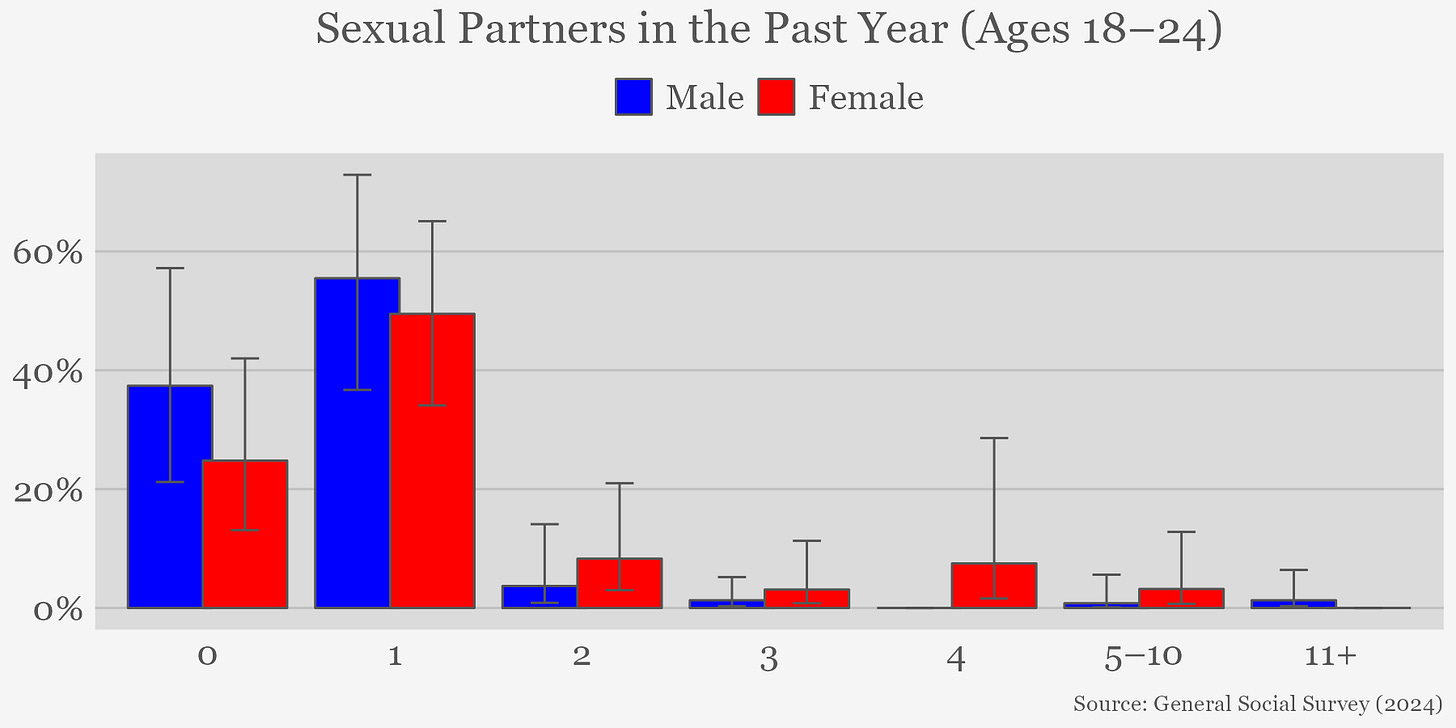
We can also look at narrower age ranges with the aforementioned caveat in mind. For 18–24s, we’re dealing with 59 men and 73 women. You can imagine how tiny it gets for 18–21s, the range the CNN Data Chief looked at.6
In this sample, 37.4% of men and 24.8% of women reported no sex partners in the past year. Ignoring the the large error bars, you could arguably make a case for a mild Chadopoly here, since the proportion of women reporting 2–10 partners was noticeably higher—though that 1.3% of men with 11+ partners would have to be doing some serious heavy lifting (or alternatively older men would). Again, no significant gender difference.7
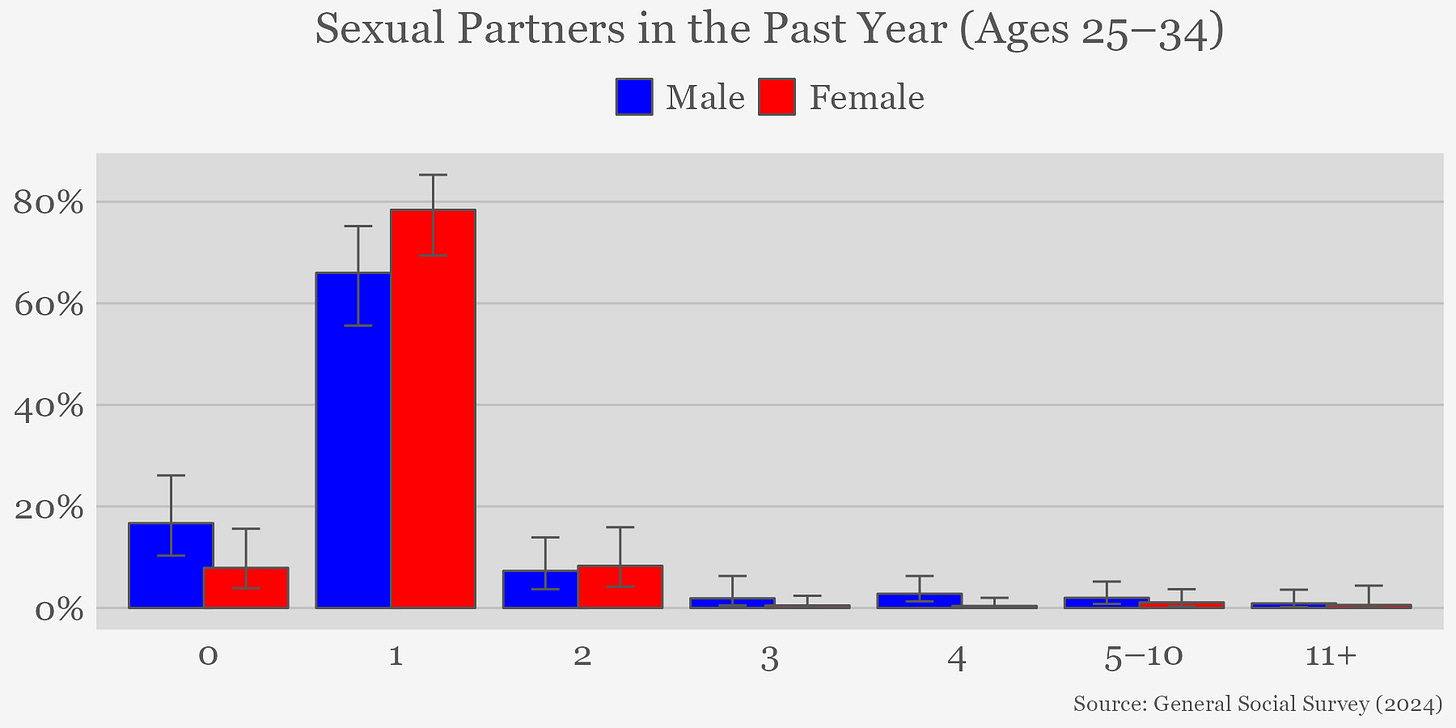
Among 25–34s (N = 144 and 176), 16.7% of men and 7.9% of women reported no sex partners in the past year, while 14.9% of men and 10.9% of women reported more than one partner. There is arguably an even milder Chadopoly pattern here of a slightly different variation, but again it’s not statistically significant.8
Takeaways from the data
Though the data might not make for quite as sexy a line-go-up graph as the fake one (at least until someone photoshops 2025/50% onto it), similar to the NSFG we nonetheless see some evidence for a continuation of the ‘sex recession’, with sexual inactivity rates among under-30 men and women higher than that seen most previous years. With survey you’d need to use moving averages to get a clearer picture—or fit a loess curve as I did. The data has been more clear and consistent when it comes to adolescent sexual activity, but it makes sense that those trends would carry over to young adulthood to some extent.
The 6–7% gap in sexual inactivity isn’t anything too out of the ordinary, and as I’ve said before, can be reasonably explained by men tending to be slightly older than their partners and a modest surplus of young men relative to women (also the CIs are obviously quite wide). There’s no need to invoke the Chad of the gaps. Adolescent trends haven't shown a gendered pattern either.
In the case of singleness, it’s possible that the apparent trend partly reflects a real trend of shrinking relational age gaps, but more than anything, it’s another reminder of how data with relatively shaky reliability—the Pew survey included—has the potential to mislead.
Regarding sexual partners, we continue to see similar distributions between men and women, as well as low levels of promiscuity; if anything they’ve declined somewhat.
Disclaimer
Consistent with other post-COVID surveys, the 2024 GSS saw a record-low response rate of 44.6%. I used the weighting variable designed to adjust for nonresponse bias, but it likely won’t have fully captured psychological differences between respondents and non-respondents.
Like the 2022–23 NSFG, this survey used a multimode design, with some respondents completing it online, which could complicate comparisons with earlier waves. The codebook recommends including the following disclaimer:
Changes in opinions, attitudes, and behaviors observed in 2021, 2022 and 2024 relative to historical trends may be due to actual change in concept over time and/or may have resulted from methodological changes made to the survey methodology during the COVID-19 global pandemic. Research and interpretation done using the 2021, 2022, and 2024 GSS data should take extra care to ensure the analysis reflects actual changes in public opinion and is not unduly influenced by the change in data collection methods. For more information on the 2021, 2022, and 2024 GSS methodology and its implications, please visit https://gss.norc.org/Get-The-Data.
Greater anonymity could theoretically reduce social desirability bias.
Among men aged 18–34, 7.4% reported three or more partners in 2024 (including ‘1 or more, unspecified’), a substantial drop from previous years. shift to multimode data collection could’ve played a role, but even in the mostly online 2021 wave, and the multimodal 2022 wave, the estimates were 15.1% and 16.7%, while before that it tended to hover around 19%. For women, the rate was 9.9%, lower than 2021 and 2022 but still above most earlier years.
Examining the data by interview mode, differences for men aged 18–34 were minimal: 7.9% for online respondents versus 7% for in-person, phone, or a combination. For women though, online respondents reported 13.3% compared to 5.5% for other modes. Interestingly, male sexlessness moved in the opposite direction to what social desirability considerations would predict: 22.5% of online respondents reported no partners versus 29.2% for other modes.
Overall, disparities by survey mode appear far less pronounced than those observed in the 2022–23 NSFG.9 This was only a brief analysis, but the variation by mode may merit closer investigation in the future.
But what about all those missing responses?
The last point I’ll address here is a common criticism of post-2018 data—particularly the 2022 survey—regarding the high number of ‘missing responses’:

I came across another article stating:
When looking at the actual breakdown of the 2021 GSS data, for example, the hard number of people telling GSS they haven’t had sex in the last 12 months is 633 out of 4,032. In fact, 46 percent of participants (1,875) either didn’t have an applicable answer, said they didn’t know, or plain didn’t answer that question.
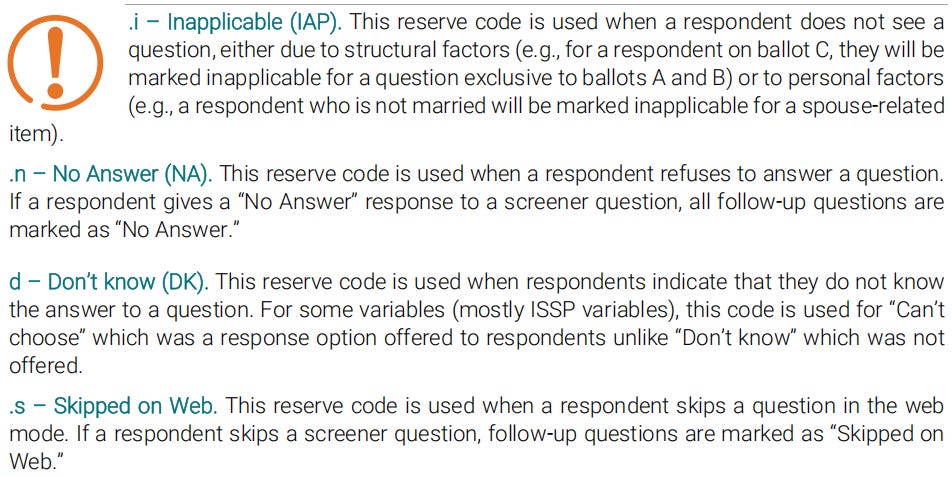
‘Inapplicable’ doesn’t mean respondents refused to answer (that’s what ‘no answer’ and ‘don’t know’ are for) or that their answers were ‘thrown out’ (as I’ve seen suggested). Rather, it simply reflects the survey design: the risky behaviours module wasn’t included in one of the ballots, so those respondents never saw the question. In 2022, it was also absent from the X form of one of the ballots (each ballot is split into two forms), which explains the apparently high number of missing responses.
SEXFREQ asks, ‘About how often did you have sex during the last 12 months?’ Of the full 3,309-person sample, 70 said they didn’t know and 160 didn’t answer. PARTNERS asks, ‘How many sex partners have you had in the last 12 months?’, and 39 said they didn’t know while 43 didn’t answer. The disparity in responses to these questions probably comes down to the fact that it’s harder to estimate how frequently you had sex in the past year than how many partners you had it with. Sexlessness rates tend to appear slightly higher when using SEXFREQ, which supports this suspicion, as obviously most people who skipped the question due to trouble recalling their sexual frequency would’ve had sex at least once. This gives PARTNERS the more accurate estimates.
The sample size for 18–29s whose ballot included the sexual behaviour module and who answered this question was 263.
Those who answered ‘I DON'T HAVE A STEADY PARTNER’ to POSSLQ/POSSLQY.
The sample size here was 453.
F = 1.0944, ndf = 6.1553, ddf = 8205.0423, p-value = 0.3631Though he did mention this in a footnote at least.
F = 1.3145, ndf = 5.3889, ddf = 1255.6113, p-value = 0.2522F = 1.5334, ndf = 5.862, ddf = 2989.617, p-value = 0.1648This may be partly because the NSFG used a web-first approach, following up later with a face-to-face interview if they didn’t respond, whereas this survey used both modes initially, following up with the alternative later. It could also be because unlike the NSFG survey, saying one hadn’t had sex didn’t allow one to skip a bunch of other questions for a small monetary reward. I couldn’t say.



What always annoys the fuck out of me with these surveys is how shallow they are, they don’t get specific and long term enough. Like wow no sex in the past year seems pretty close between men and women, okay now make it 3, 5, 10 years and you’ll see the insane disparity.
It really just makes me assume they don’t go that long term and have more specific(“precise”) questions is cause the disparity would look too bad, the picture it would paint for men would be too bleak and we rather not acknowledge that and give them more ammo. It sounds conspiratorial but I just read from you on this post that they have now even removed the body / partner count from the stats and immediately I can only think oh wow must be cause it’s too “misogynistic” of a question that sets a “problematic” precedent.
I really can’t think of a legit reason why they’d suddenly remove such a vital stat
Spreadsheet Niggers should be flogged in the street.