
The lesser Asian variability and creativity hypotheses
Can these explain East Asia's apparent relative lack of innovation?

HIGHLIGHTS
East Asians do not appear to show lower variability in cognitive performance.
East Asians tend to perform somewhat worse on creativity tests.
East Asian cultures tend to be more collectivist, which may stunt innovation, though Japan and the US may be closer than commonly believed.
Factors proposed to explain East-West cultural differences include Confucianism, pathogen prevalence, climatic stability, rice farming, and kinship systems.
There is evidence of varying quality for a genetic effect on culture, and vice versa.
Japan has largely caught up to the West in Nobel prizes per capita in the 21st century.
China now leads the world in several research metrics, yet still lags in innovation.
It has long been hypothesized that men display greater variance in intelligence than women, being overrepresented at both ends of the distribution. This greater male variability is consistently seen in IQ and scholastic tests, though the difference is less pronounced than in hypothetical graphs that are often posted.
This hypothesis has also been invoked to account for differences in scientific and technological innovation between East Asians relative to Europeans.1 An apparent puzzle is that despite the reportedly higher average IQs of East Asians, the industrial and scientific revolutions emerged in Europe rather than China.
While China deserves credit for its ‘four great inventions’,2 it was the West that created the modern world. China (5) has won fewer Nobel Prizes in the hard sciences than Belgium (6), despite a population some 120 times larger; Japan (24) has won only slightly more than Switzerland (20), despite a population some 14 times larger (more on this later).
A graph is sometimes presented in support of the lesser Asian variability hypothesis:
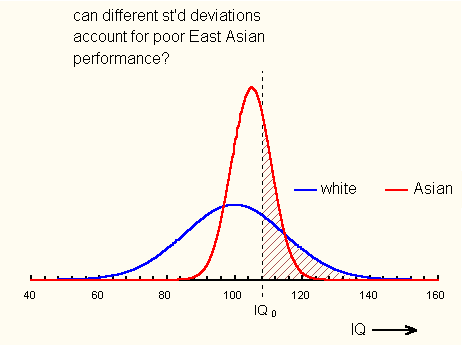
The problem is that this is a hypothetical graph based on the degree of distributional narrowing among East Asians required to produce comparable ‘smart fractions’. On the WISC-V, the full-scale IQ standard deviation was similar for Asians (14.4) and European Americans (14.6), though the Asian sample size was small (n = 89). It has also been shown that Asians exhibit more variance in SAT and ACT scores, which correlate highly with IQ, but a limitation of these findings is that in the US, ‘Asian’ includes South and Southeast Asians.
The Programme for International Student Assessment (PISA) evaluates the mathematics, science, and reading performance of 15 year olds around the world. PISA scores also correlate strongly with IQ (0.88). Higher male variance is replicated in this dataset, with a similar variance ratio (1.19) to that seen in other datasets.3 This is a good sign; if East Asians have a meaningfully different level of variance, it should also be detectable here.
Variability in East Asian PISA scores
Six countries and territories with predominantly East Asian populations took part in the 2022 PISA:4 Japan, South Korea, Singapore, Hong Kong, Taiwan, and Macao.
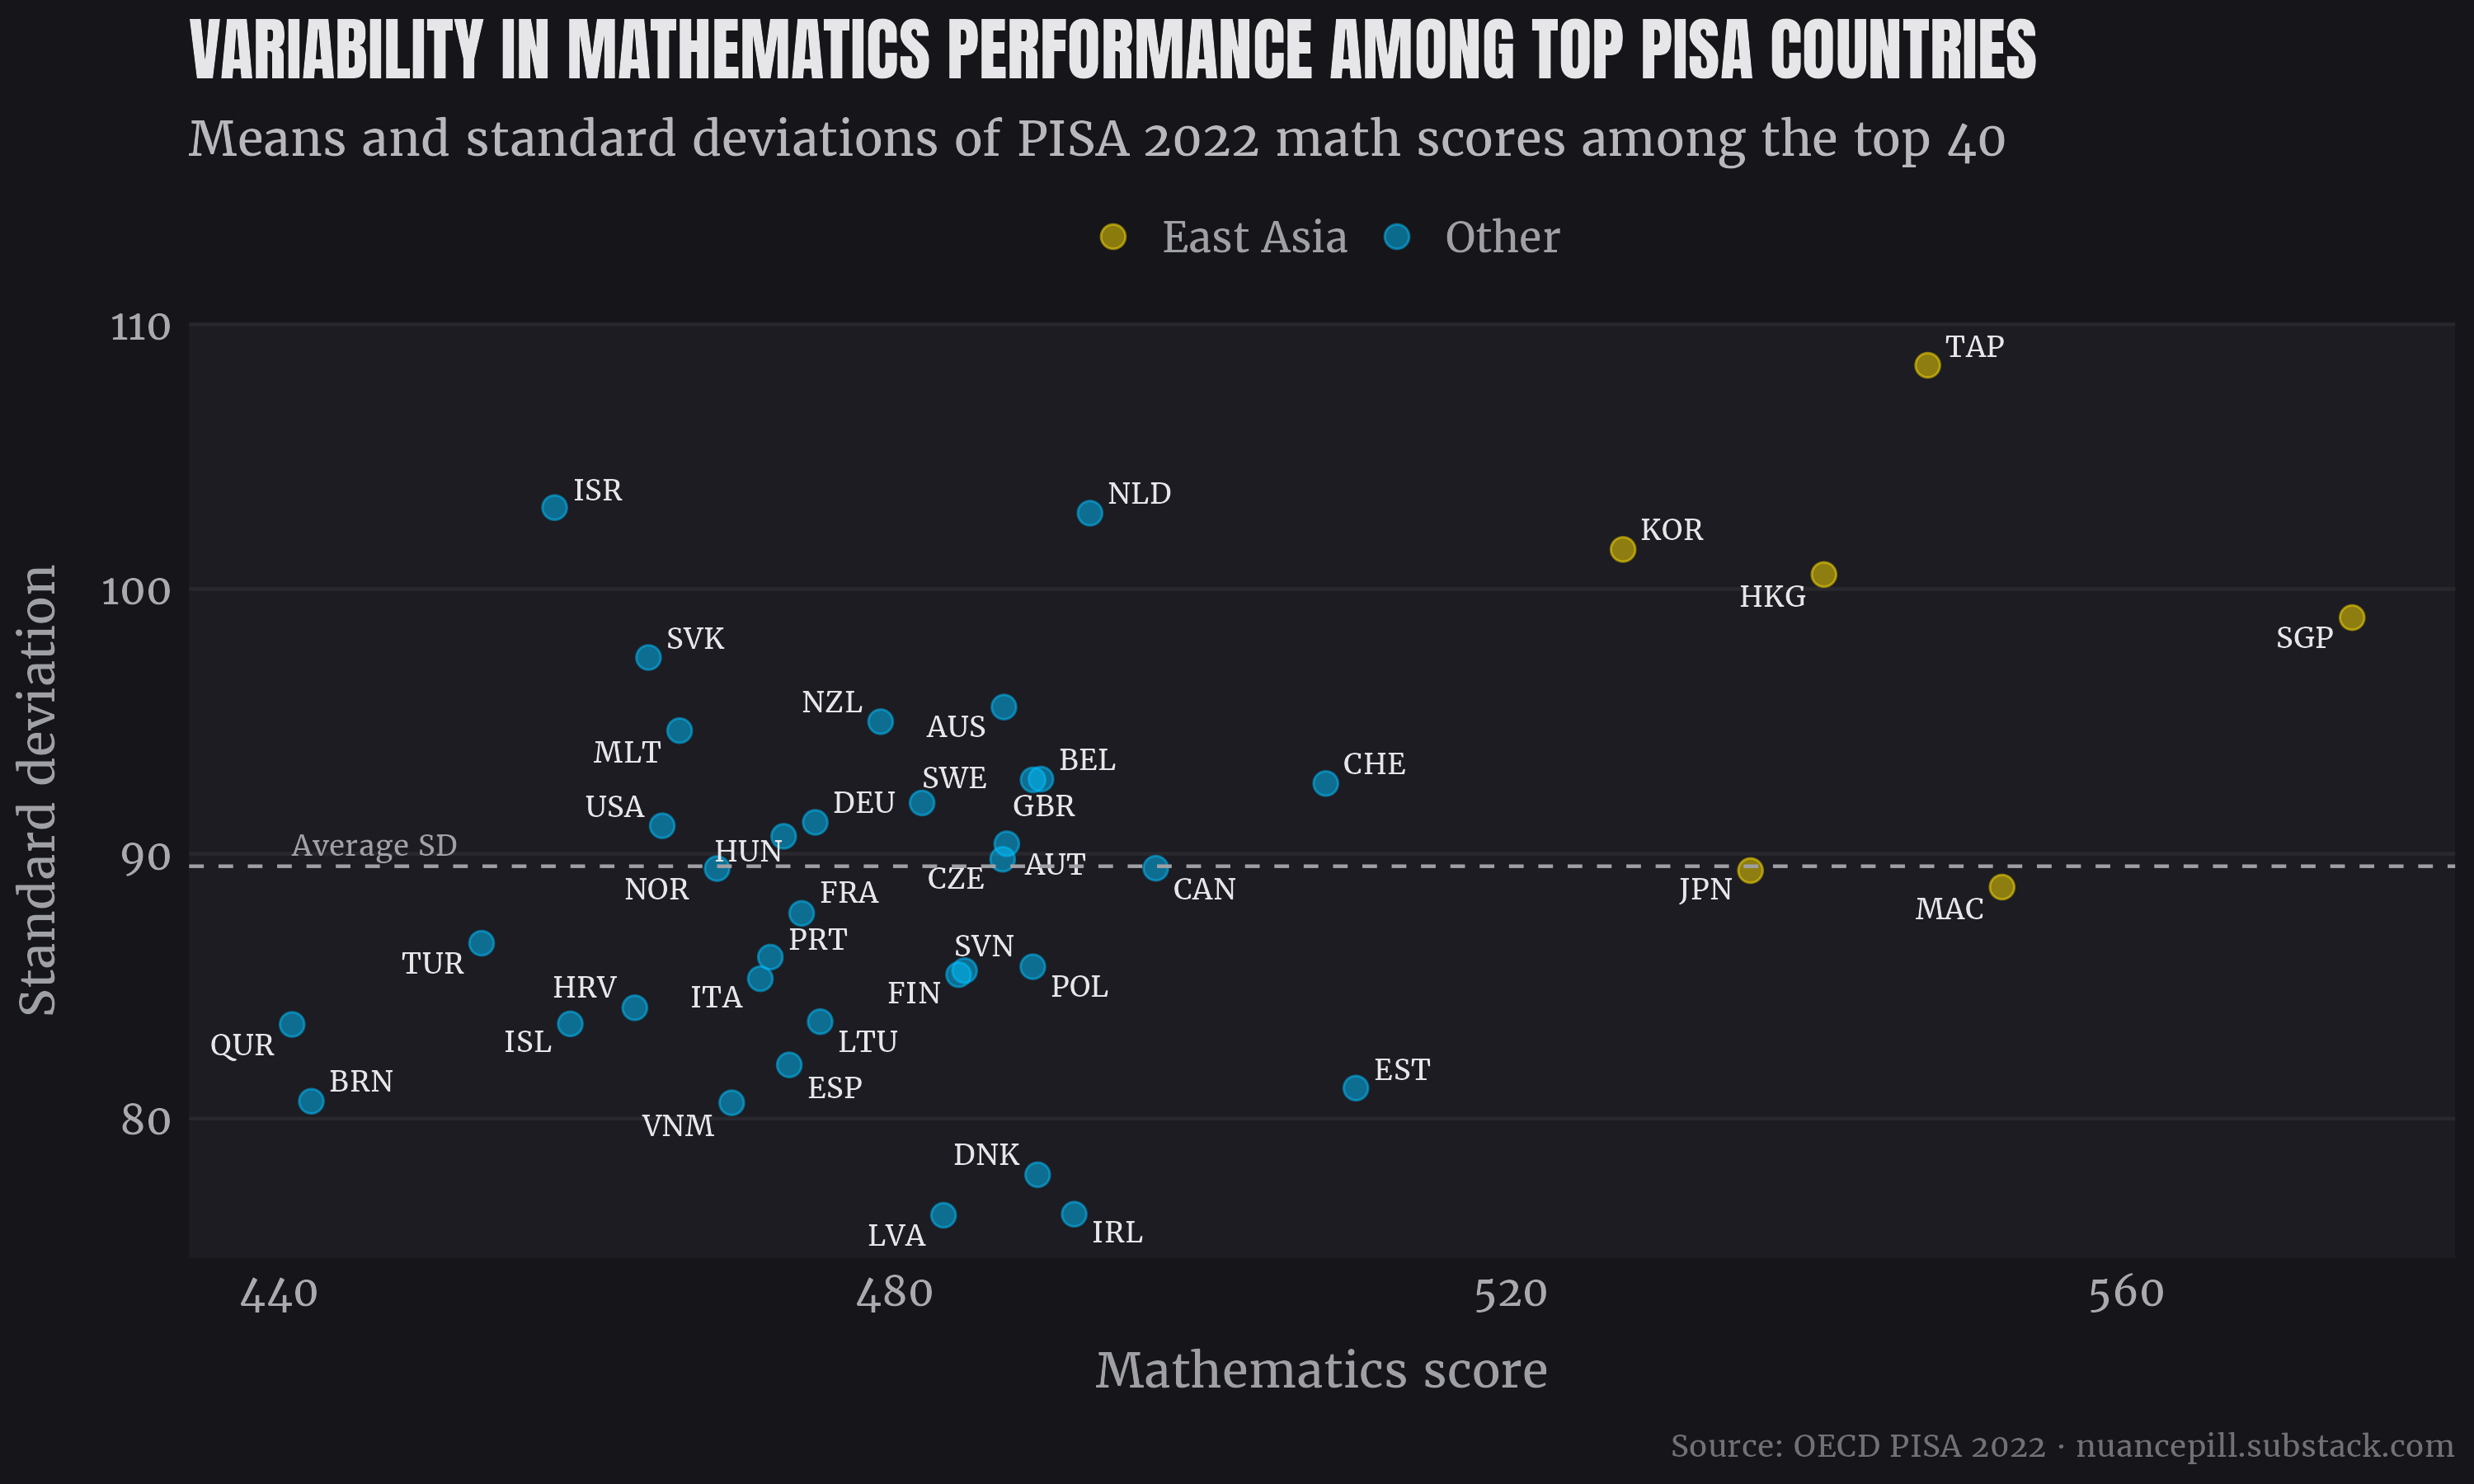
We’ll first look at the standard deviations for the top 40 performing countries in each subject to see whether the spread for East Asian countries is notably lower than the average among these countries.5
For math performance, the East Asian Six were no less variable; on the contrary, four of the six had above average standard deviations, with Taiwan showing the highest.
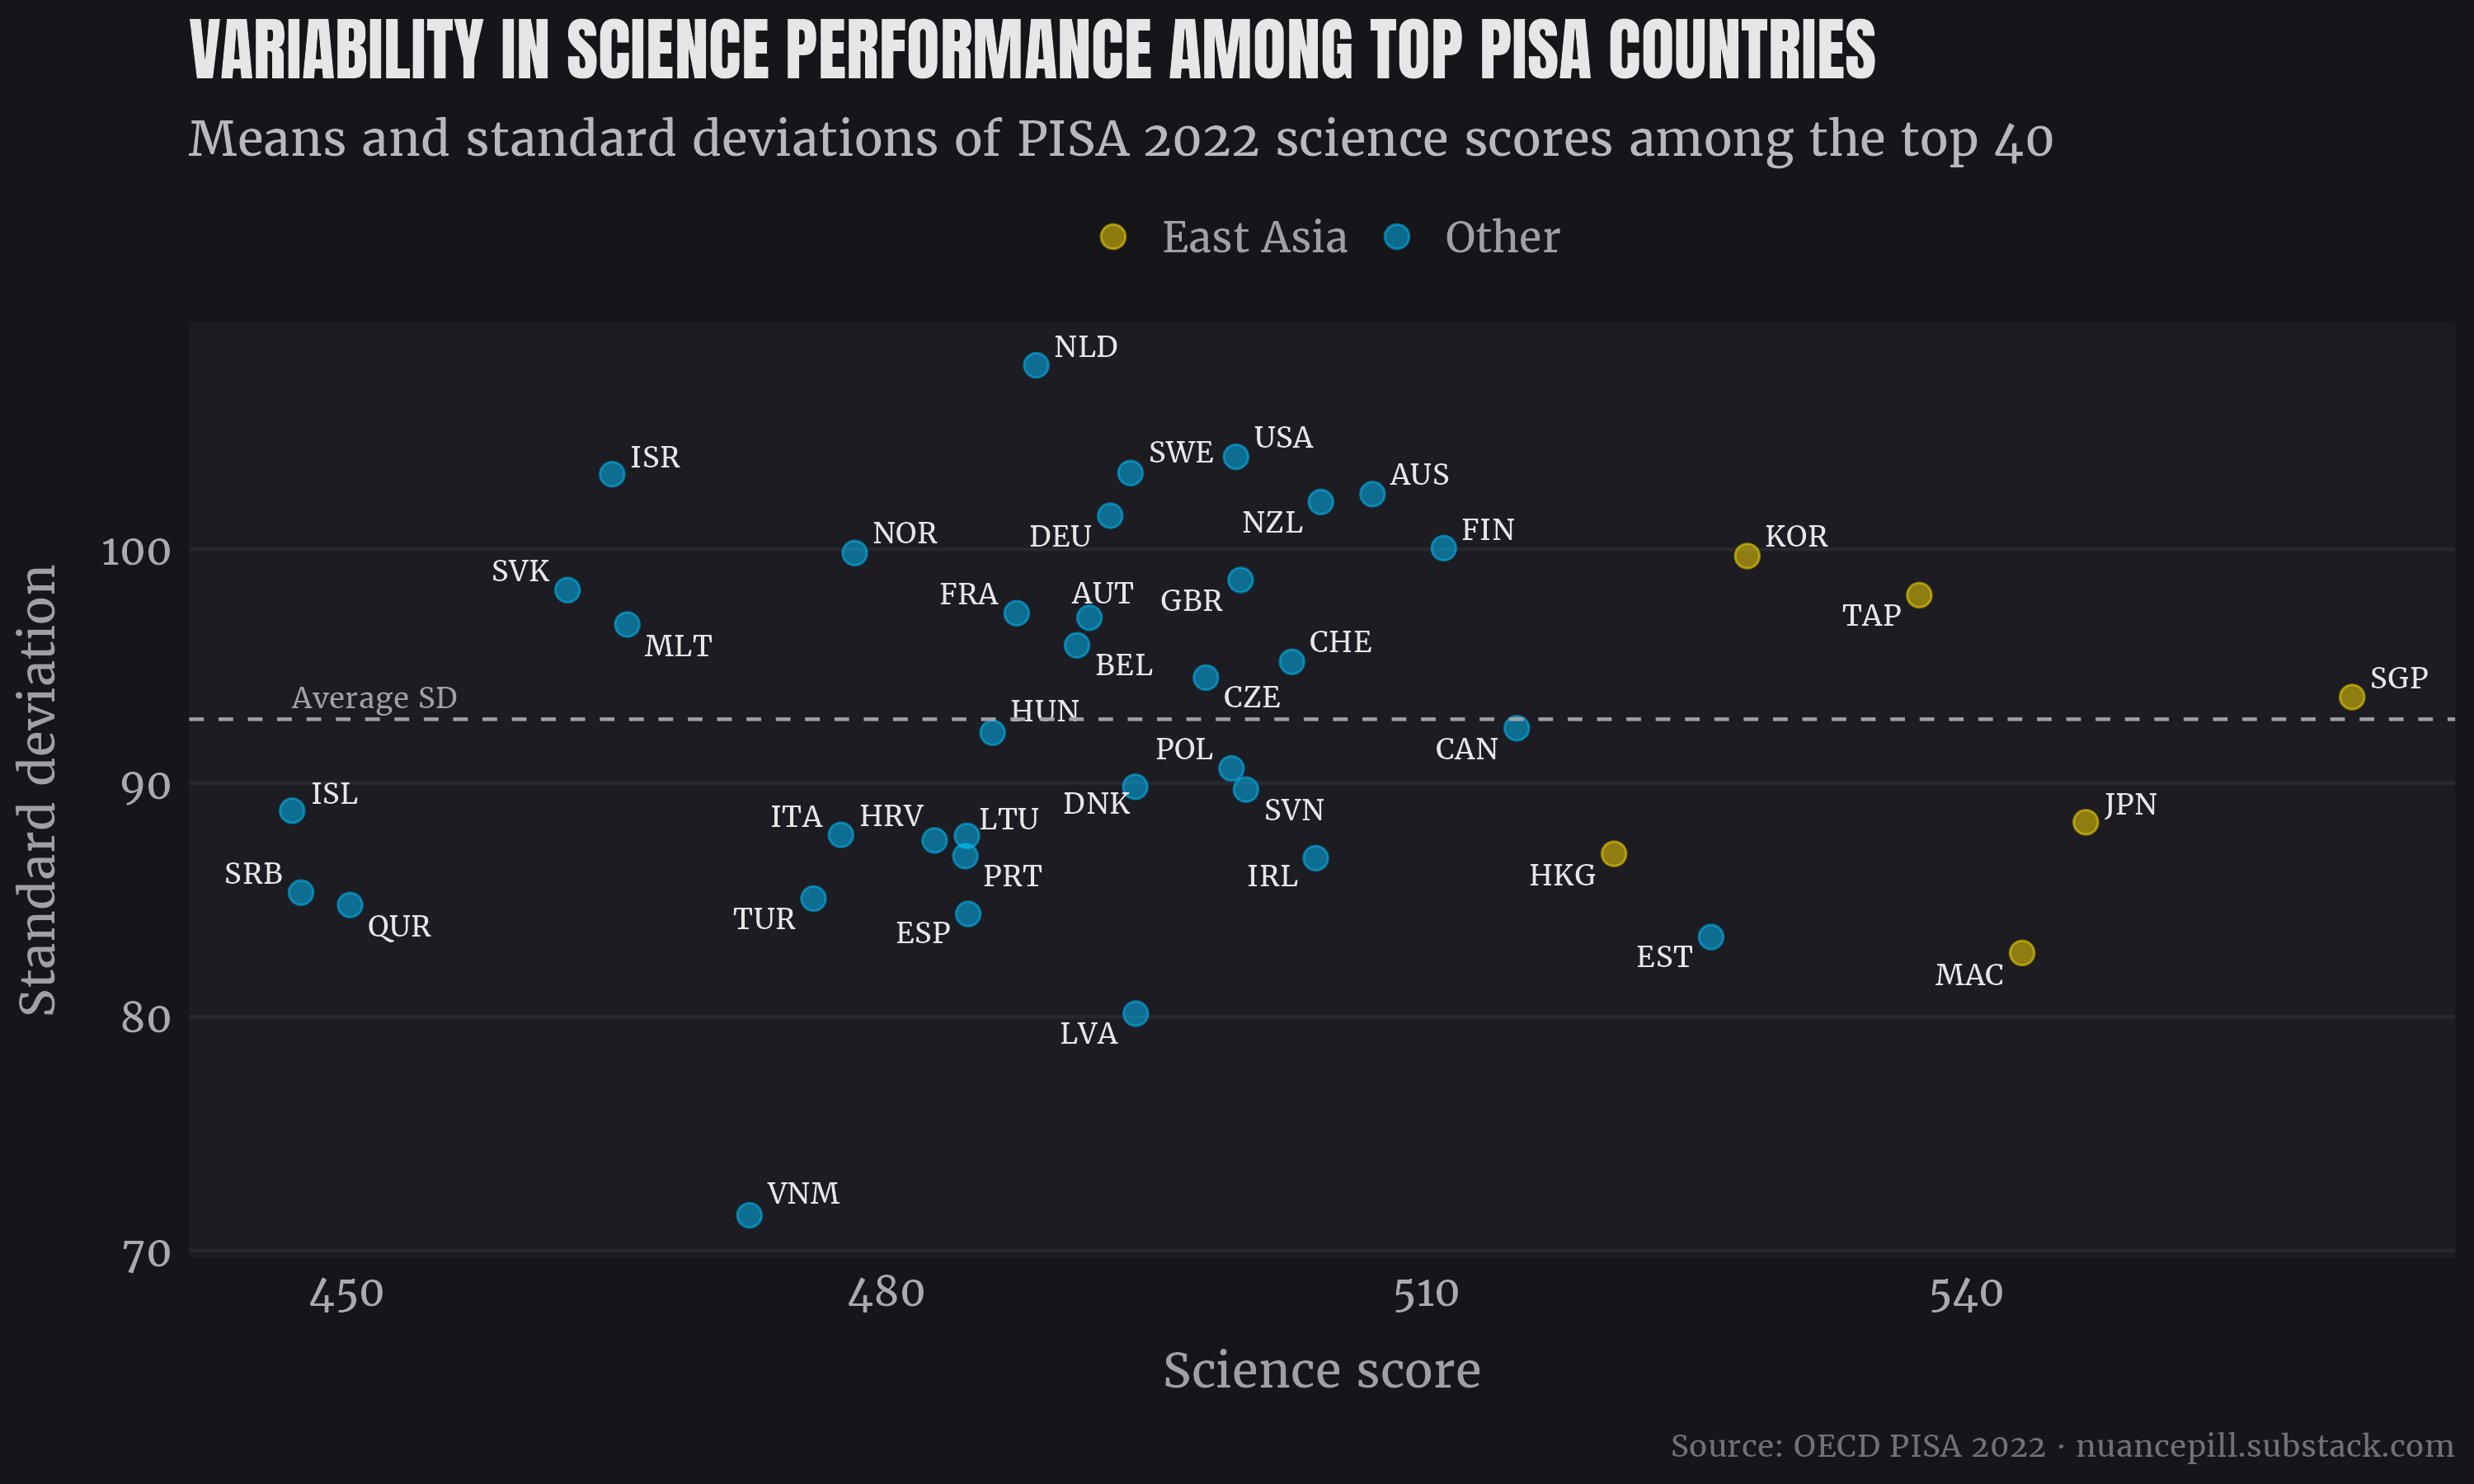
For science, there was an even split.
Same goes for reading.
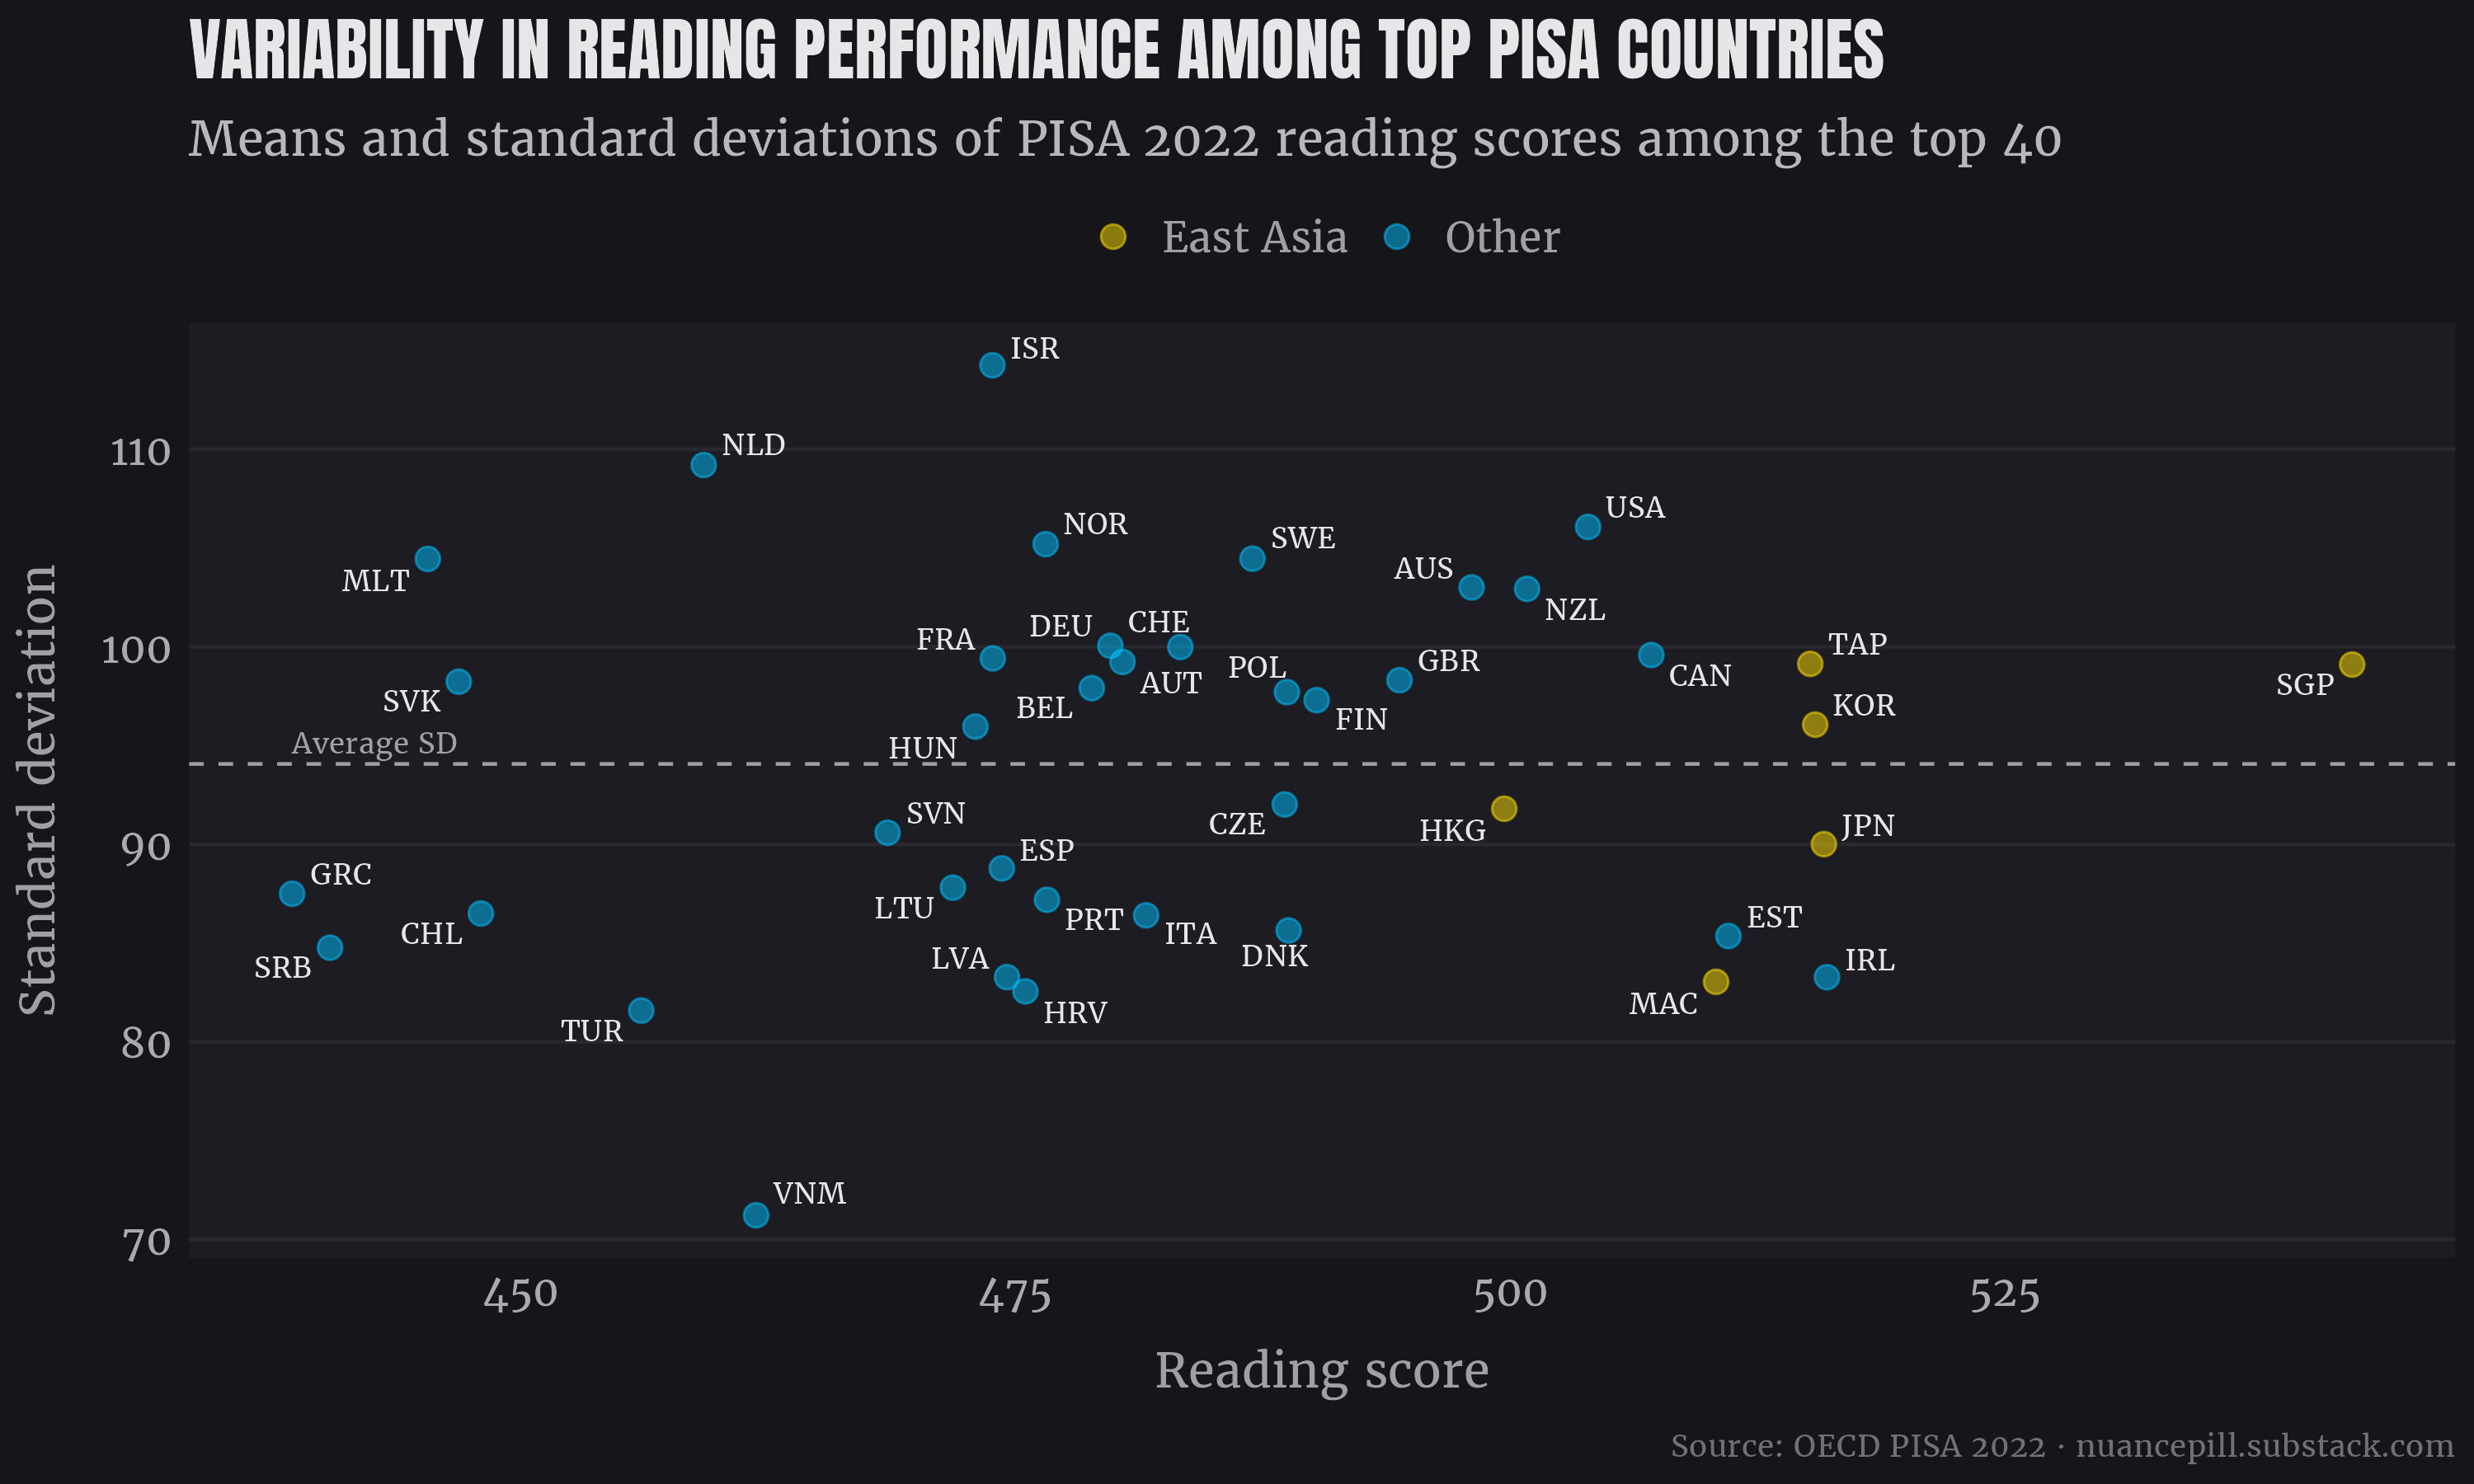
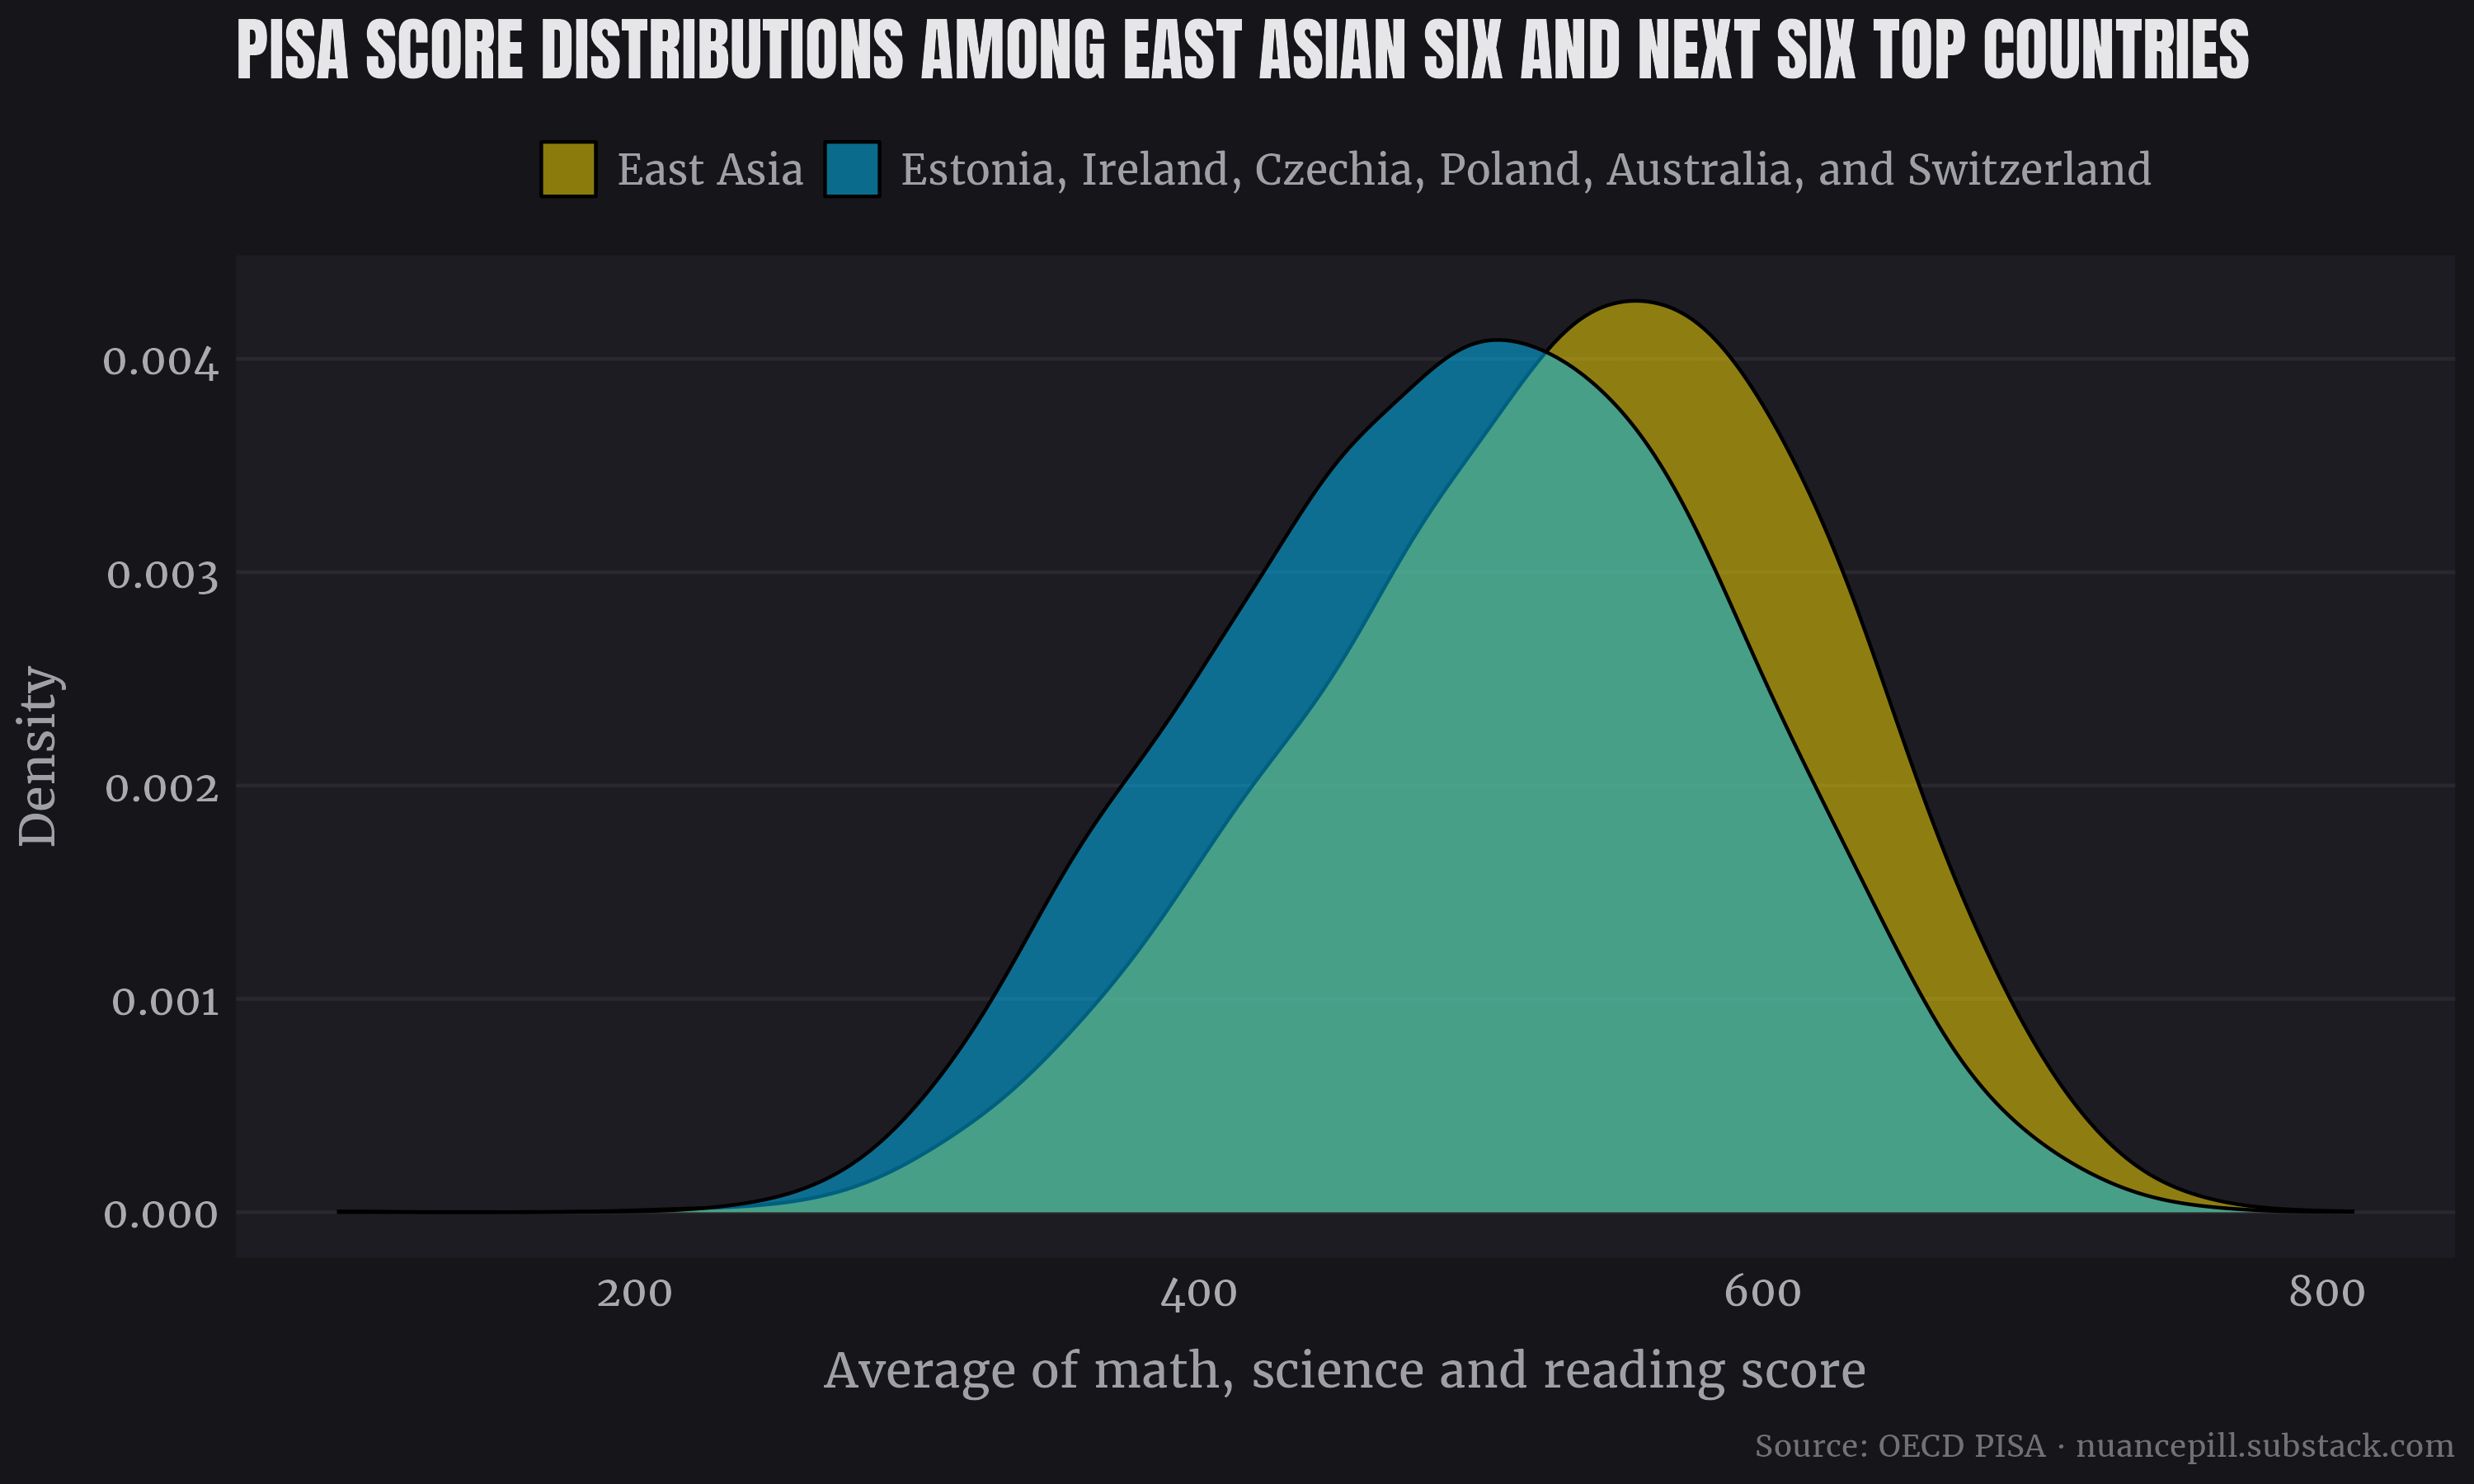
Among above-average performers, East Asian countries don’t appear to be notably less variable, even though many countries are considerably more demographically diverse, which likely explains Israel’s high variance. East Asian countries and the next six highest performing countries6 show virtually identical variance. The mean of the subject means was 530.8 for East Asia and 495.5 for the next six, with standard deviations of 89.9 and 90.3 respectively (VR = 0.99).
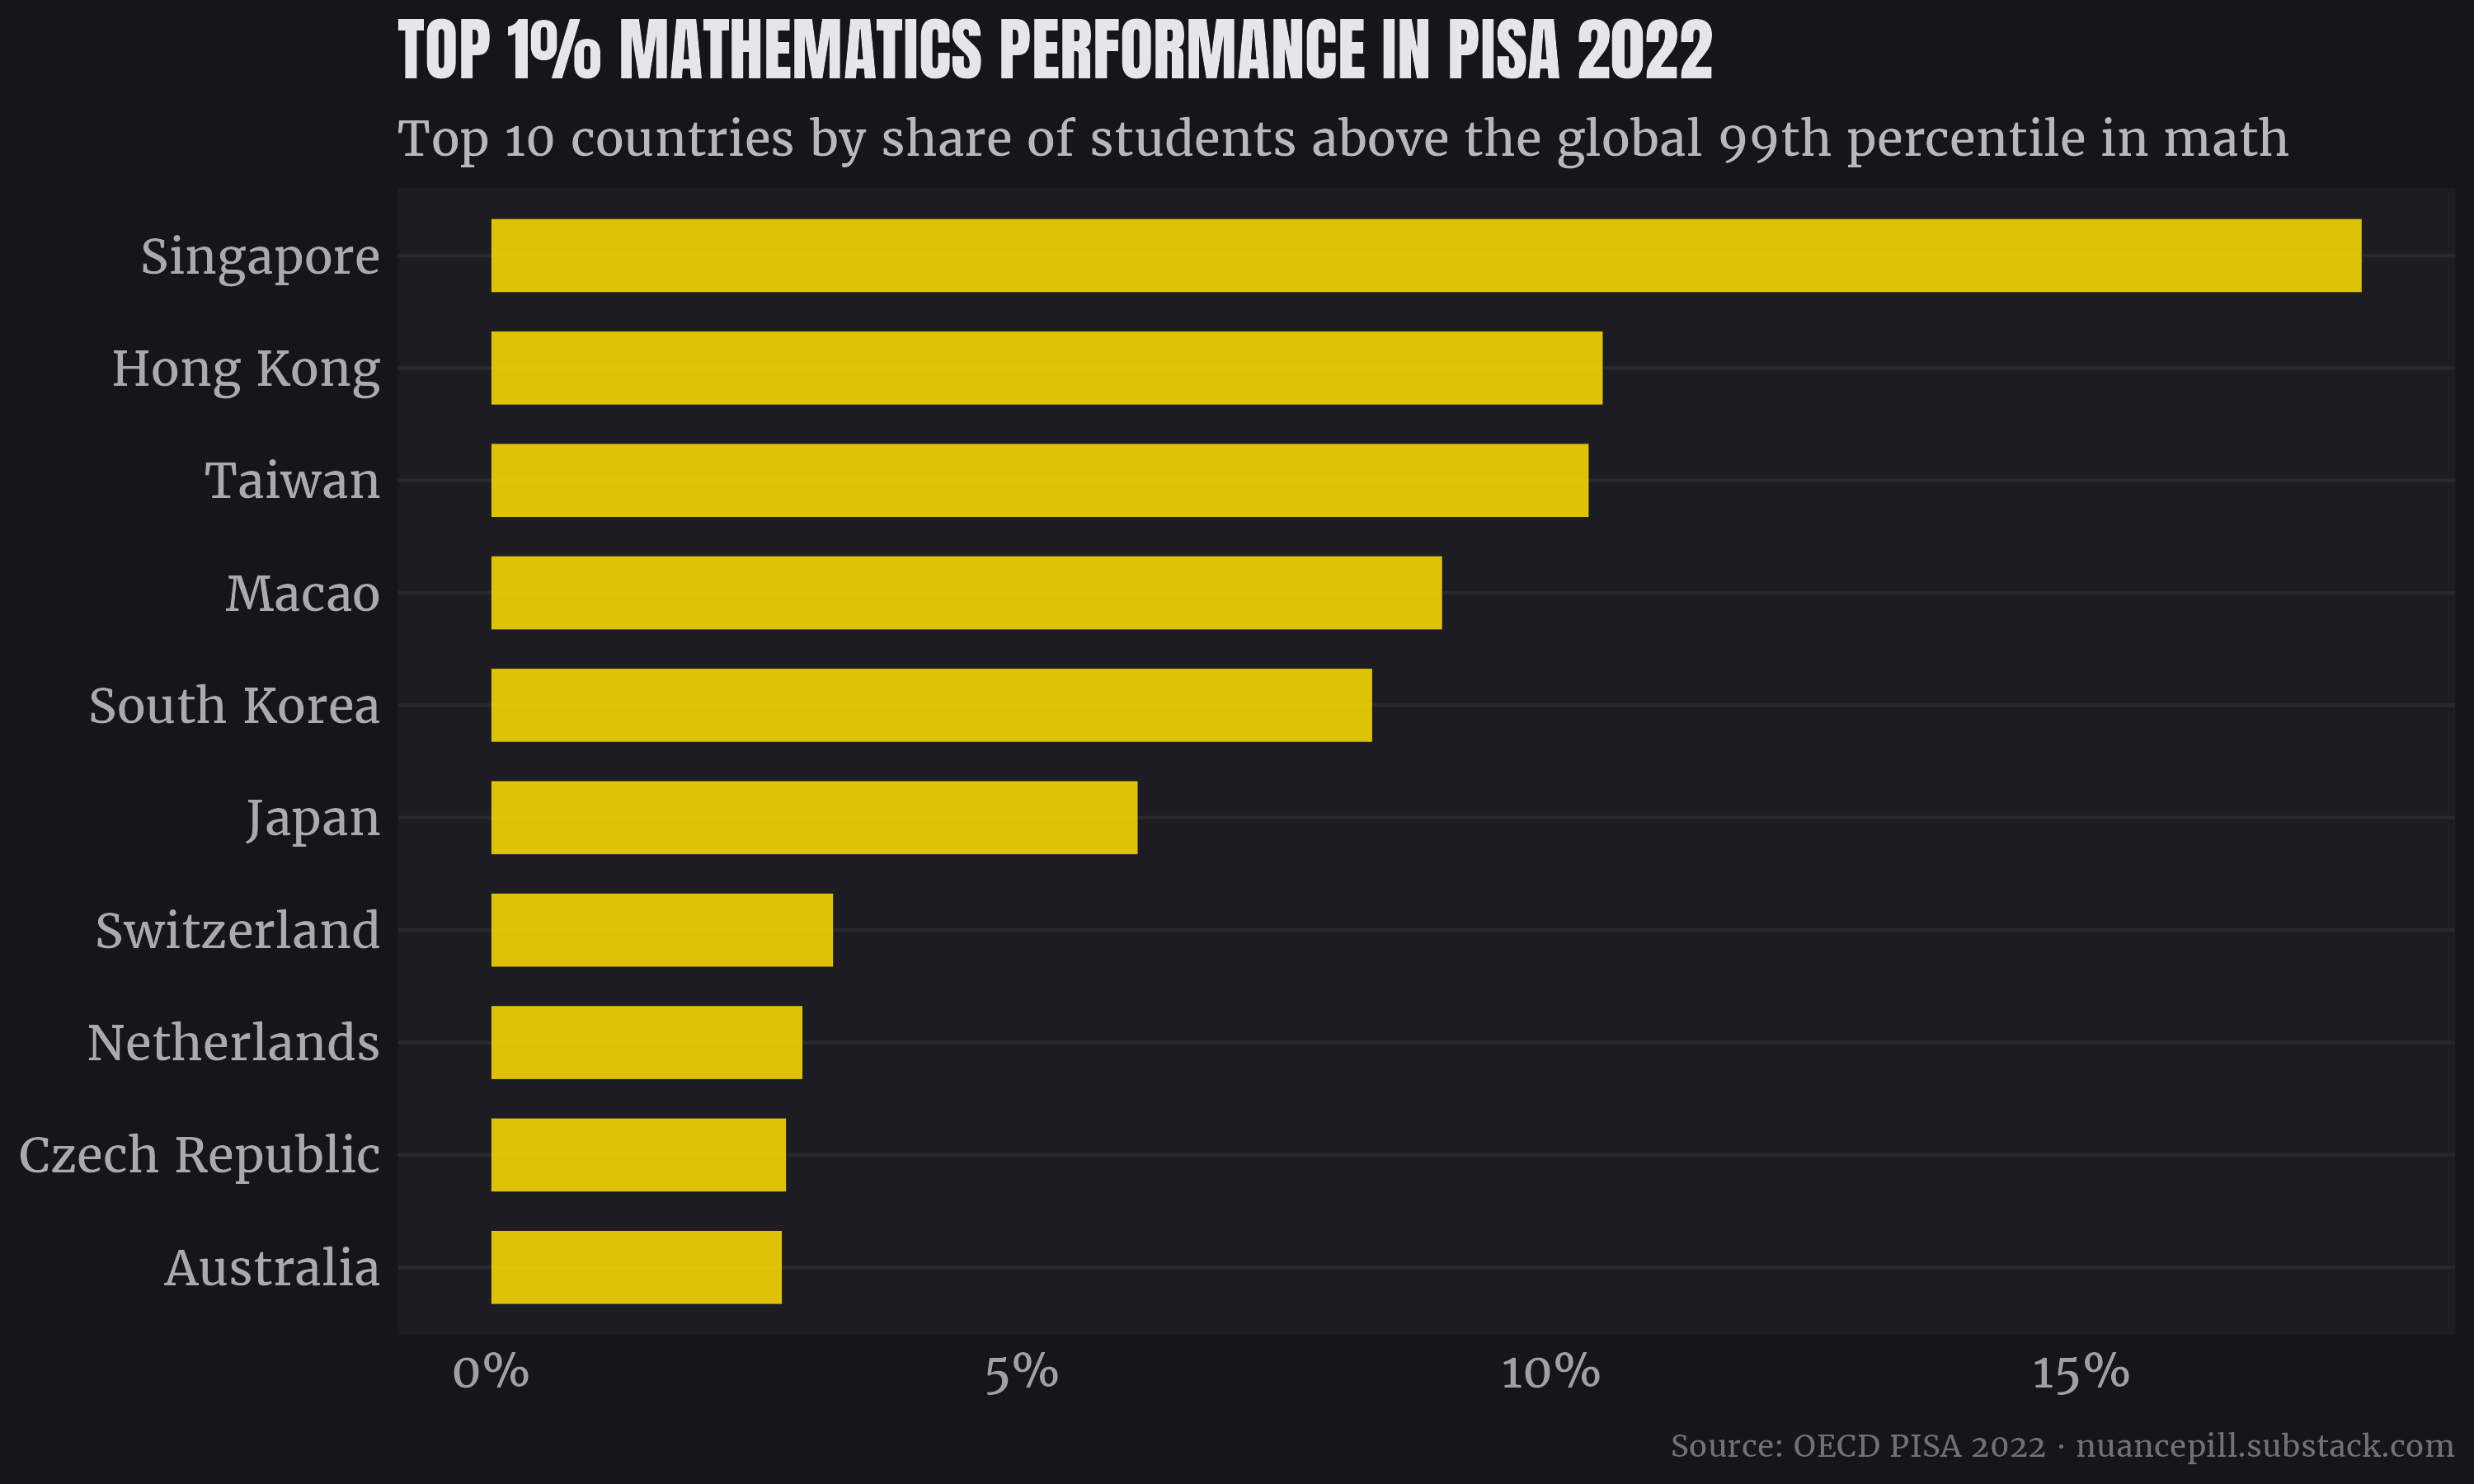
The share of students exceeding the 99th percentile in the PISA sample provides a closer look at elite performers. In mathematics, the East Asian Six made a clean sweep, with Singapore overrepresented by a factor of 17.6.
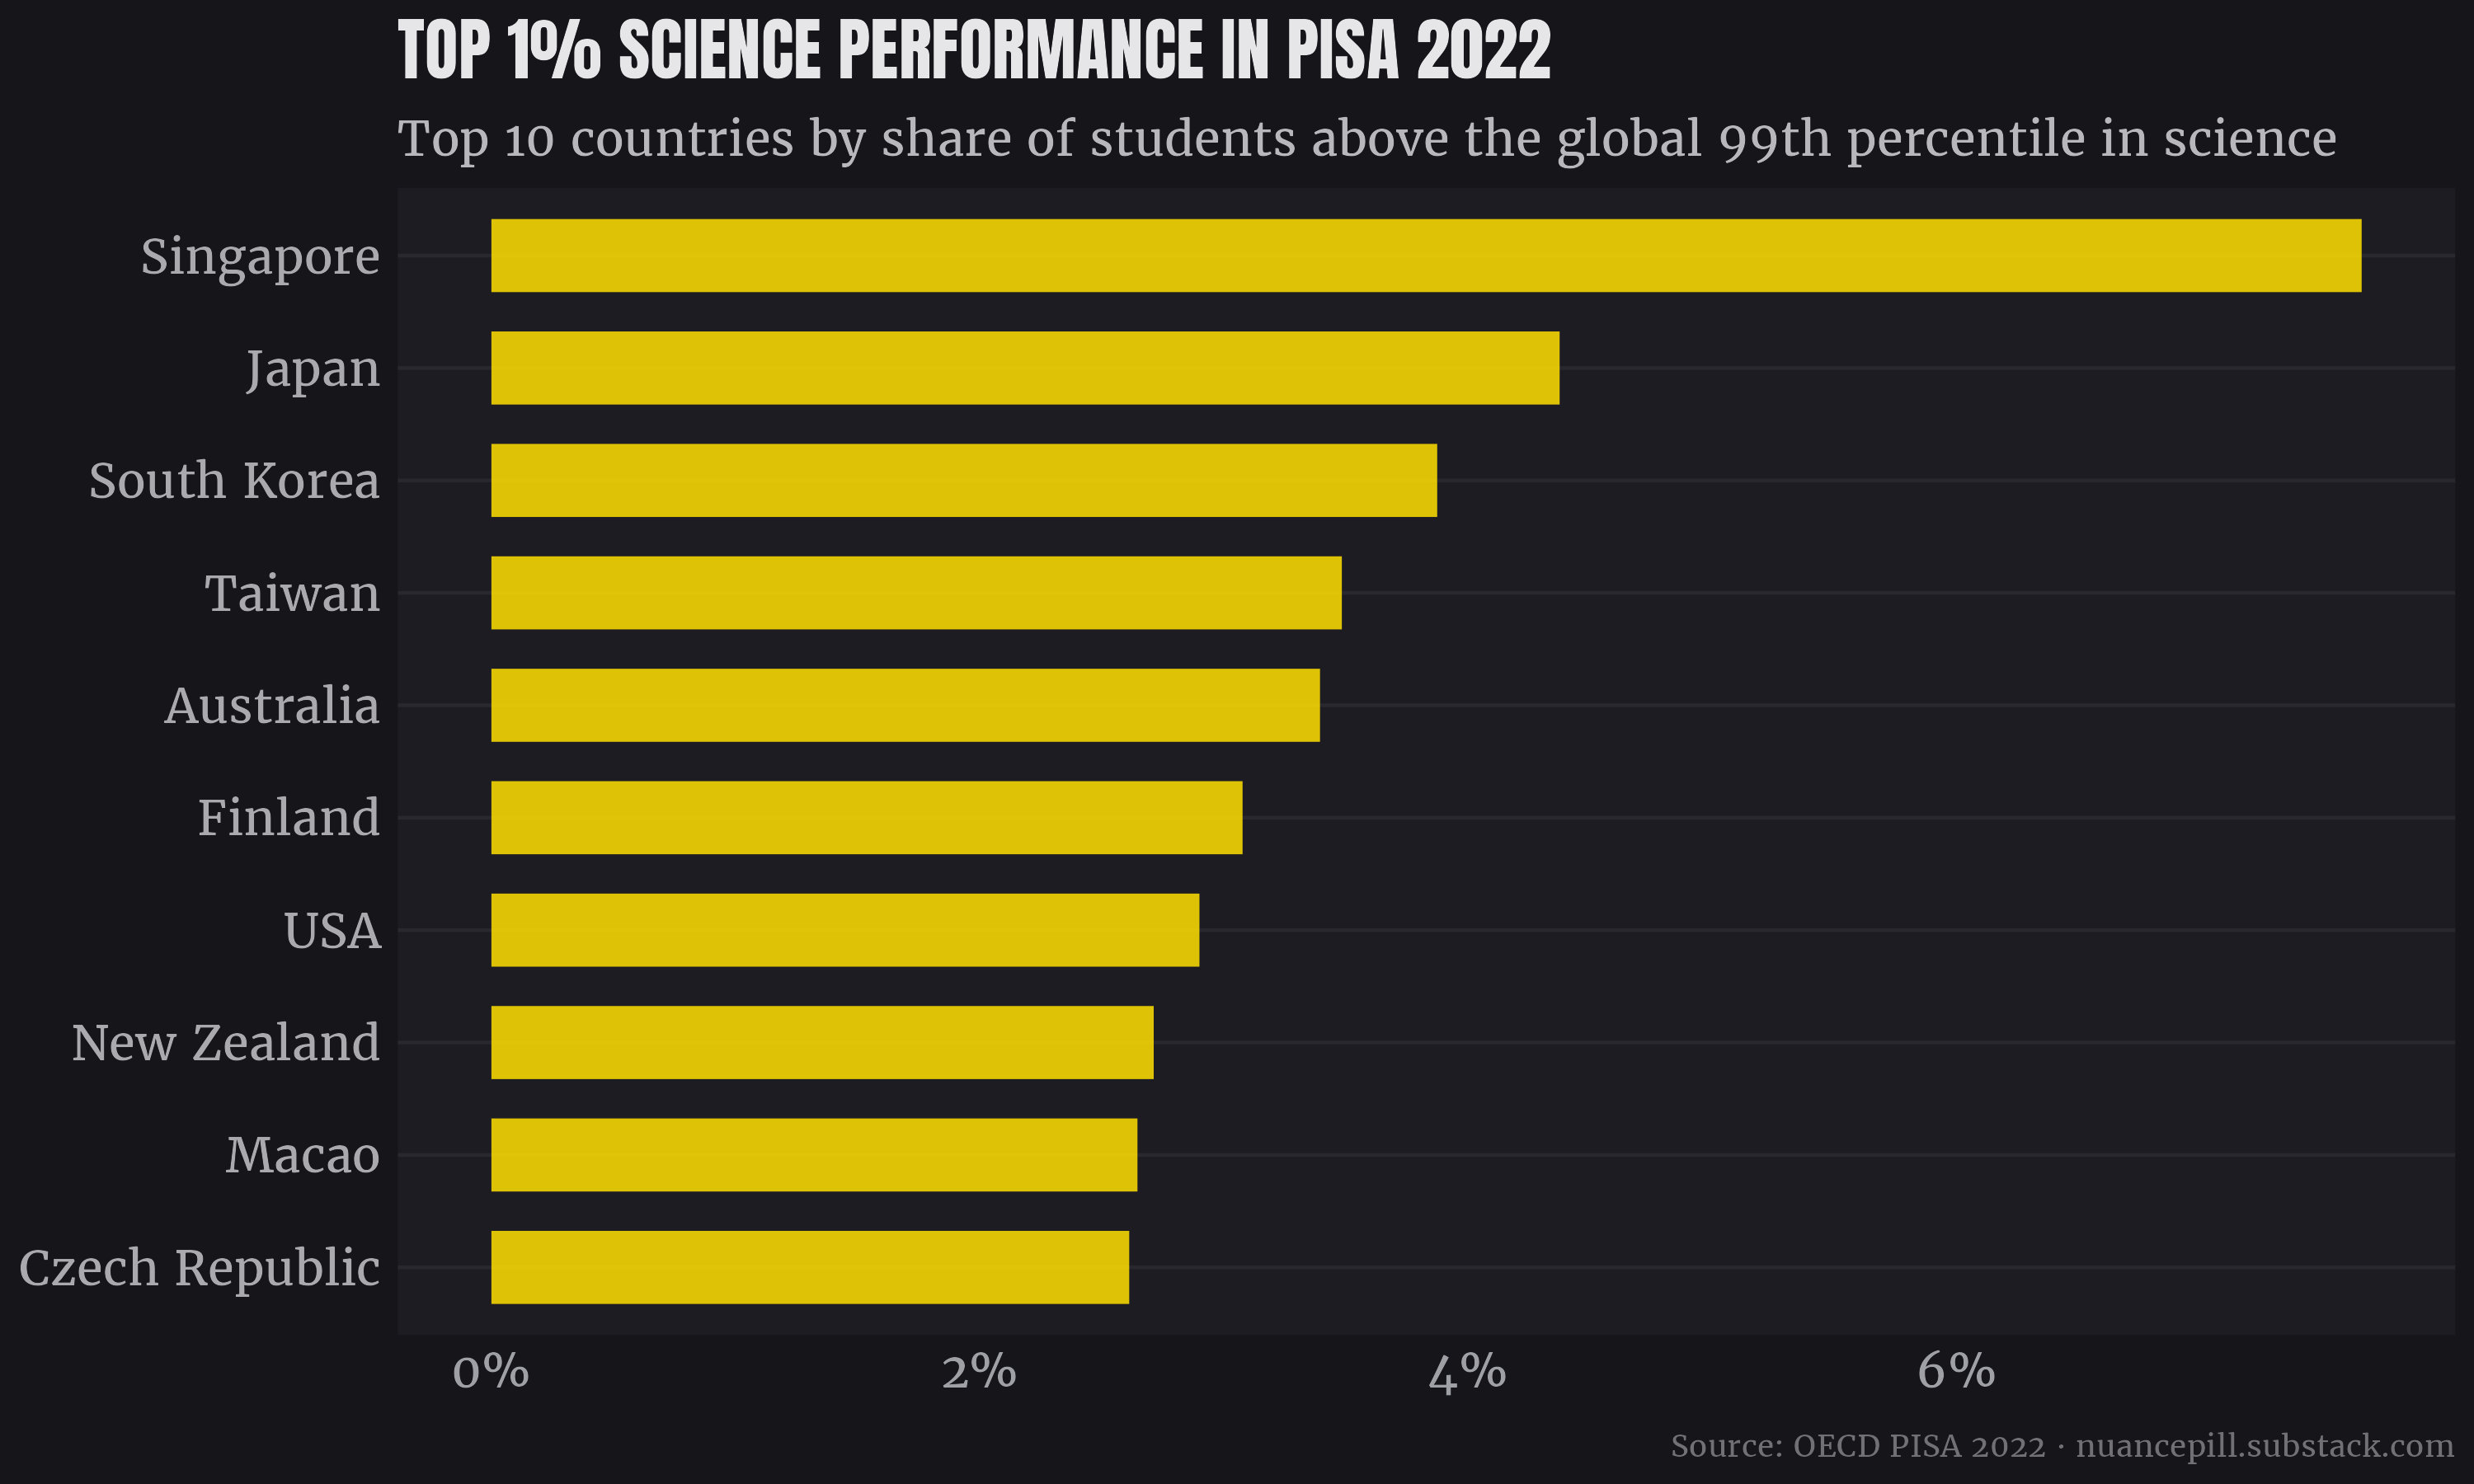
For science, four East Asian countries top the list, with five in the top 10.
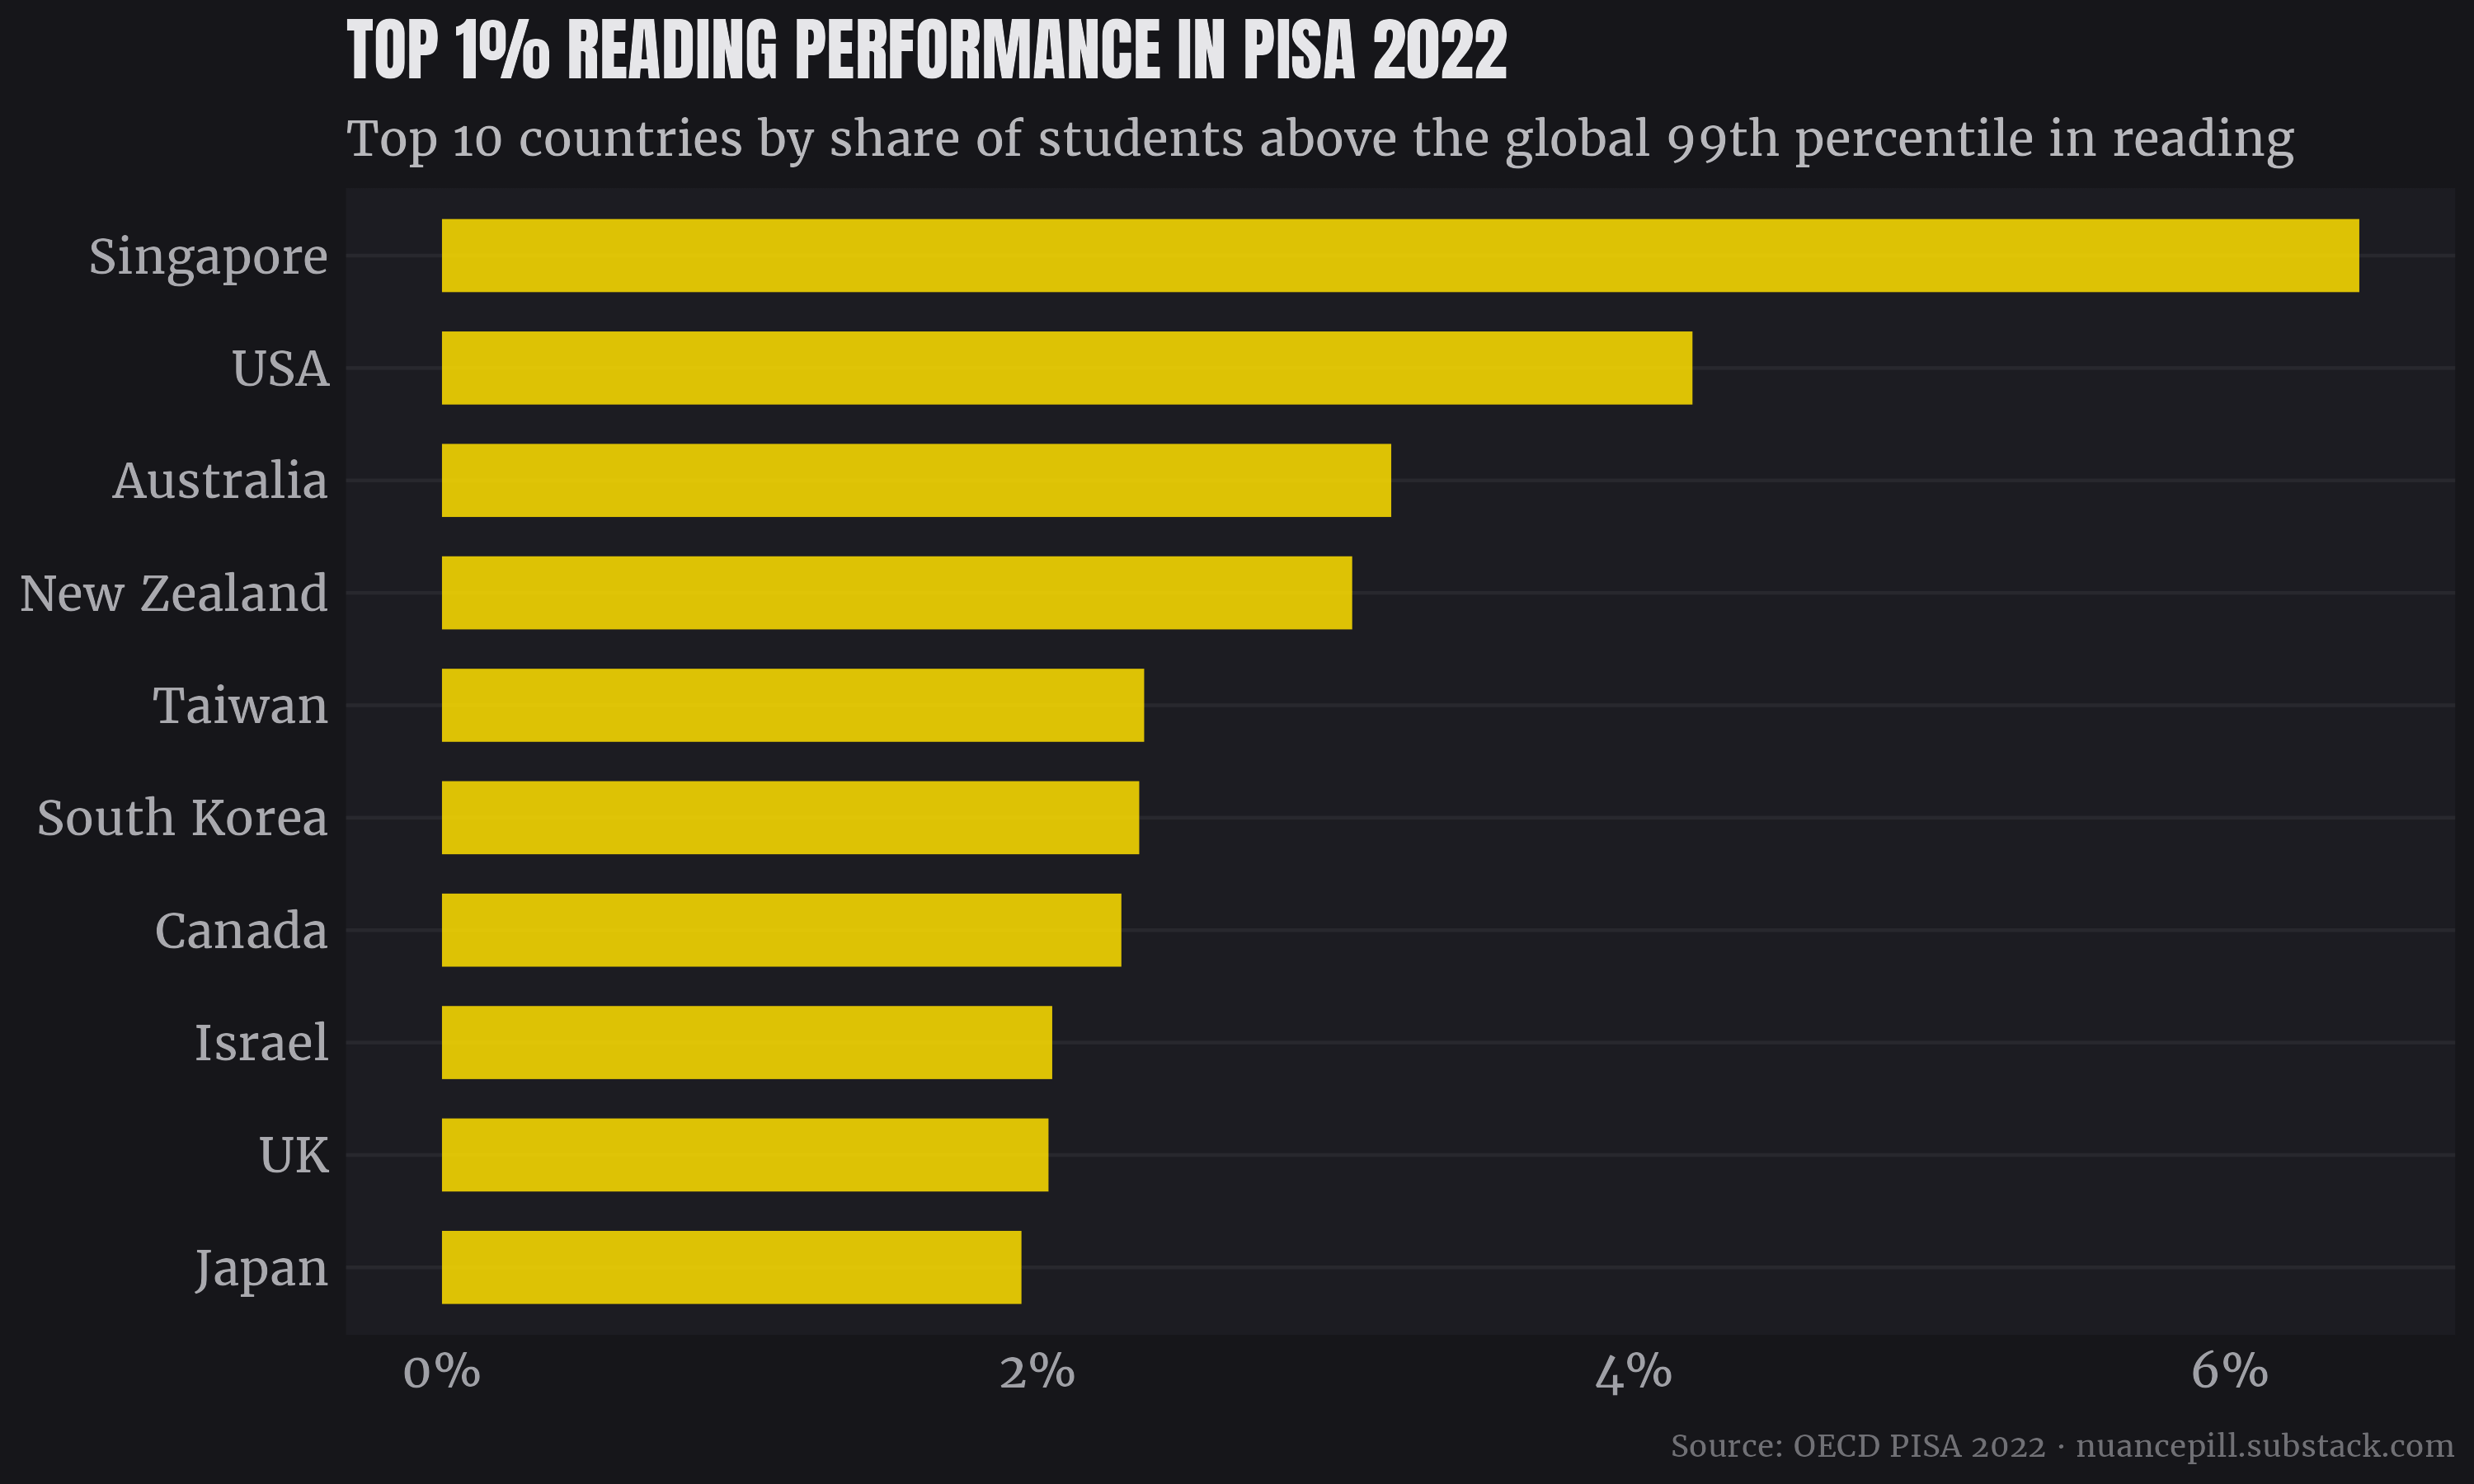
For reading, four of the East Asian Six remain in the top ten, and Singapore still dominates, though ranks two through four are occupied by Anglosphere countries.7 Reading is the closest available proxy for verbal ability, so the weaker East Asian dominance here is consistent with psychometric data indicating that their cognitive advantage is limited to the visuospatial and mathematical domains. A similar pattern is visible in universities, where the Asian-to-white ratio is higher in fields associated with stronger quantitative and analytical GRE performance (i.e. STEM), much like the male-to-female ratio. Interestingly, a similar cognitive profile has been observed in Native American and Inuit populations, which share deep ancestral roots with East Asians.
One might argue that this isn’t capturing ‘real’ genius – we must look even further into the right tail. With similar standard deviations but a higher mean, East Asians will remain overrepresented when extrapolating further out. Whether it’s safe to assume the distributions behave predictably at the extremes is another question. PISA is designed to evaluate education systems rather than to precisely rank individuals, making it ill-equipped for this level of analysis. Each student only answers a subset of the total test items, and ‘plausible values’ are imputed to estimate latent ability. It also lacks sufficiently difficult items to discriminate with precision at the top. Past a certain point, performance may measure endurance and a lack of careless slip-ups more than anything. Not to mention the typical national sample sizes of 4,000–8,000 are inadequate for this purpose.
Then again, this is also the case with IQ tests; reliability declines sharply past the 130 mark. Once you reach three standard deviations above the mean, they effectively break down and must rely on extrapolation. Norming samples are simply too small to determine what a 145 IQ even looks like, and designing items that can reliably distinguish someone at that level from someone with a 150 IQ is a nearly impossible task. This is how you can be sure 200 IQ supergenius claims are bunk. More fundamentally, it’s not clear that a stratospheric IQ is necessary for what we’d call a ‘genius’ anyway. Feynman famously scored 125 upon entering high school, though he could well have had a lopsided cognitive profile.
One might also argue that the predominantly Han Chinese countries aren’t representative of this ethnic group as a whole. Singapore is an interesting case: the majority of its Han Chinese population descends from labourers from the southeastern coastal provinces who were driven by poverty and periods of political instability. Its long-serving prime minister Lee Kuan Yew was IQ-pilled, calling The Bell Curve a ‘fact of life’ and leading a technocratic government that prioritized skilled migration with its foreign talent policy, so this heavy filtering may explain its dominance despite peasant origins.
There’s little reason to believe the Han Chinese who populate Taiwan represent an elite sample. As with Singapore, the vast majority of its modern Han population descend from poor settlers who migrated from southeastern coastal provinces between the 17th to 19th century. A minority descend from those who fled from the mainland following the defeat of the Nationalist government – a more stratified cohort that included elite talent, but also a large contingent of peasant soldiers. That Taiwan nonetheless performs as well as it does on the PISA and averages 105 on IQ tests is arguably evidence that the average genotypic IQ of Mainland China is roughly similar. East Asians also display higher polygenic scores for educational attainment, even if these are associated with personality traits as well as cognitive ability. The puzzle remains: if variance isn’t the explanation, what accounts for the innovation gap?
The lesser Asian creativity hypothesis
A perception more widespread than lesser Asian variability is that Asians lack creativity. They’re often stereotyped as robotic human calculators, much like autistic savants. Perhaps while they’re good students, adept at absorbing and reproducing information, the secret sauce needed to generate novel insights is in short supply.
While more than capable of incrementally refining existing systems, developing entirely new ones seems less common: research and development projects focused on improving existing business lines are more common in Japan, whereas R&D in the US is more focused on expanding the technology base. Rather than a deficit in creativity per se, the East may place a higher premium on usefulness and the West on novelty.
Even defining creativity is a challenge. A working definition is the ability to produce ideas or solutions that are both novel and useful. This is inherently harder to measure empirically than raw cognitive ability, where tests have clear-cut right and wrong answers; if creativity is reduced to a score on a standardized test, it arguably misses the point.
Of course, this hasn’t stopped psychologists from trying. Typically, creativity is measured using divergent thinking tasks, such as generating as many uses as possible for a common object like a brick, with responses assessed on fluency, flexibility, originality, and elaboration. Other tasks involve generating connections between seemingly unrelated words and turning abstract lines into complete drawings.
Meta-analyses show only modest correlations of 0.2–0.25 between IQ and divergent thinking, IQ and creative achievement, and creativity and academic achievement. Dechaume et al. (2024) analysed data from 854 children, 238 with IQs of 130 or above. While positive associations were identified between convergent-integrative thinking and both verbal comprehension and processing speed, no clear IQ threshold for creativity was identified.8 This aligns with the observation that plenty of smart people produce derivative work, while less smart ones can produce compelling art. Composing a complex symphony might depend on both though – and the same may be true for scientific innovation.
On the question at hand, a meta-analysis examining individual creativity between Western and Eastern samples reported a small- to-moderate difference favouring Westerners (g = 0.329). This Western advantage was larger for older cohorts and test-like divergent thinking tasks, whereas game-like tasks showed no significant difference. American college students also report more creative activities and achievements9 than their Chinese counterparts.
This gap extends to artistic output: several studies have found that Western students produce artwork rated as more creative and aesthetically pleasing than that of Chinese participants, with both Western and Chinese judges largely agreeing on their evaluations. Asian students in Western countries tend to perform closer to Caucasian students than do students in China, which could suggest cultural influences, though selection effects can’t be ruled out.
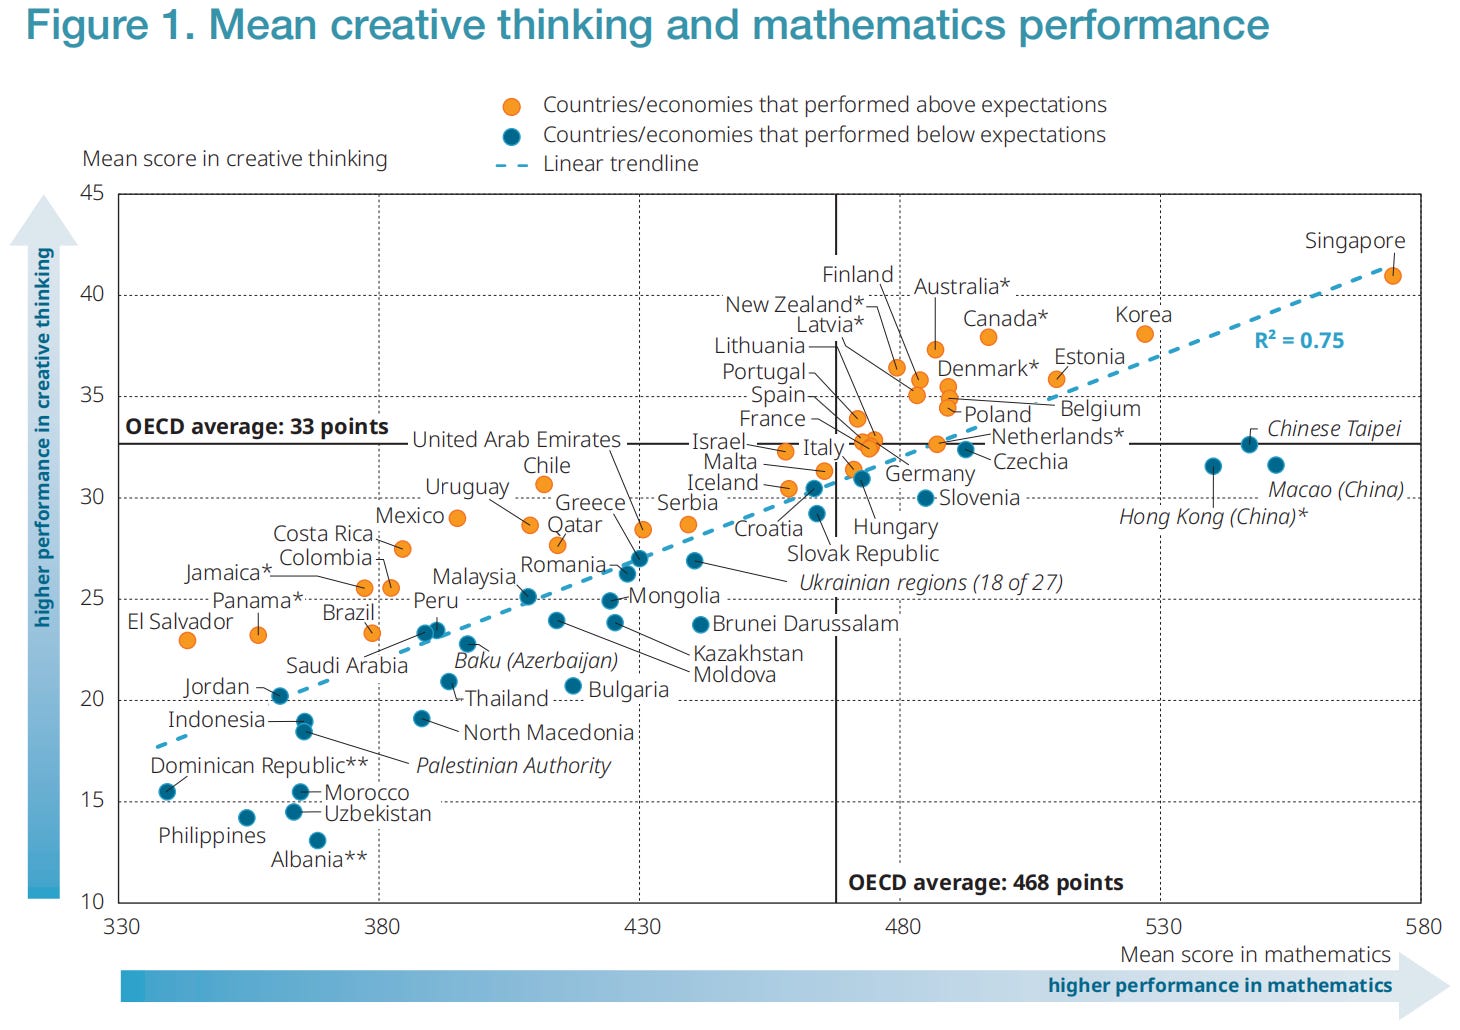
The 2022 PISA also assessed creative thinking, tasking students with open-ended scenarios that required imagination (e.g. writing a story) or solving problems in social and scientific contexts. Across nations, creative thinking scores closely tracked performance in core cognitive domains. There were some notable exceptions: students in Hong Kong, Taiwan, and Macao underperformed relative to what their mathematics scores would predict, landing close to the OECD average. South Korea and Singapore did better.10
It should be said that what’s being measured here is more ‘everyday’ creativity under structured conditions, which may not translate well into genuinely novel breakthroughs.
Openness to Experience
People high in Openness to Experience tend to be imaginative, intellectually curious, and more willing to challenge convention. Scientific visionaries are often driven more by intrinsic curiosity than by practical outcomes. This has been argued to explain lower East Asian innovation. Of the Big Five traits, openness is most closely linked to intelligence, creativity, and innovation behaviour; at the national level, it has also been found to predict both innovation inputs and outputs.
In cross-national research, McCrae et al. (2005) reported somewhat lower openness in East Asian than Western countries, with higher global scores driven largely by Northwestern Europe. Using college student samples, Schmitt et al. (2007) similarly found that East Asian nations reported the lowest openness out of all regions. The same was true for extraversion, agreeableness, and conscientiousness, while they reported the highest levels of neuroticism. Essentially, East Asian respondents tended to rate themselves in a more socially unfavourable direction across the board. The conscientiousness finding is particularly inconsistent with cultural stereotypes, but isn’t limited to this study; another found that Japan ranked lowest. Kajonius & Mac Giolla (2017) also reported lower openness in both East Asia and the US, and Rocha (2025) found lower openness in mainland China, while Hong Kong and Singapore showed levels comparable to European nations.
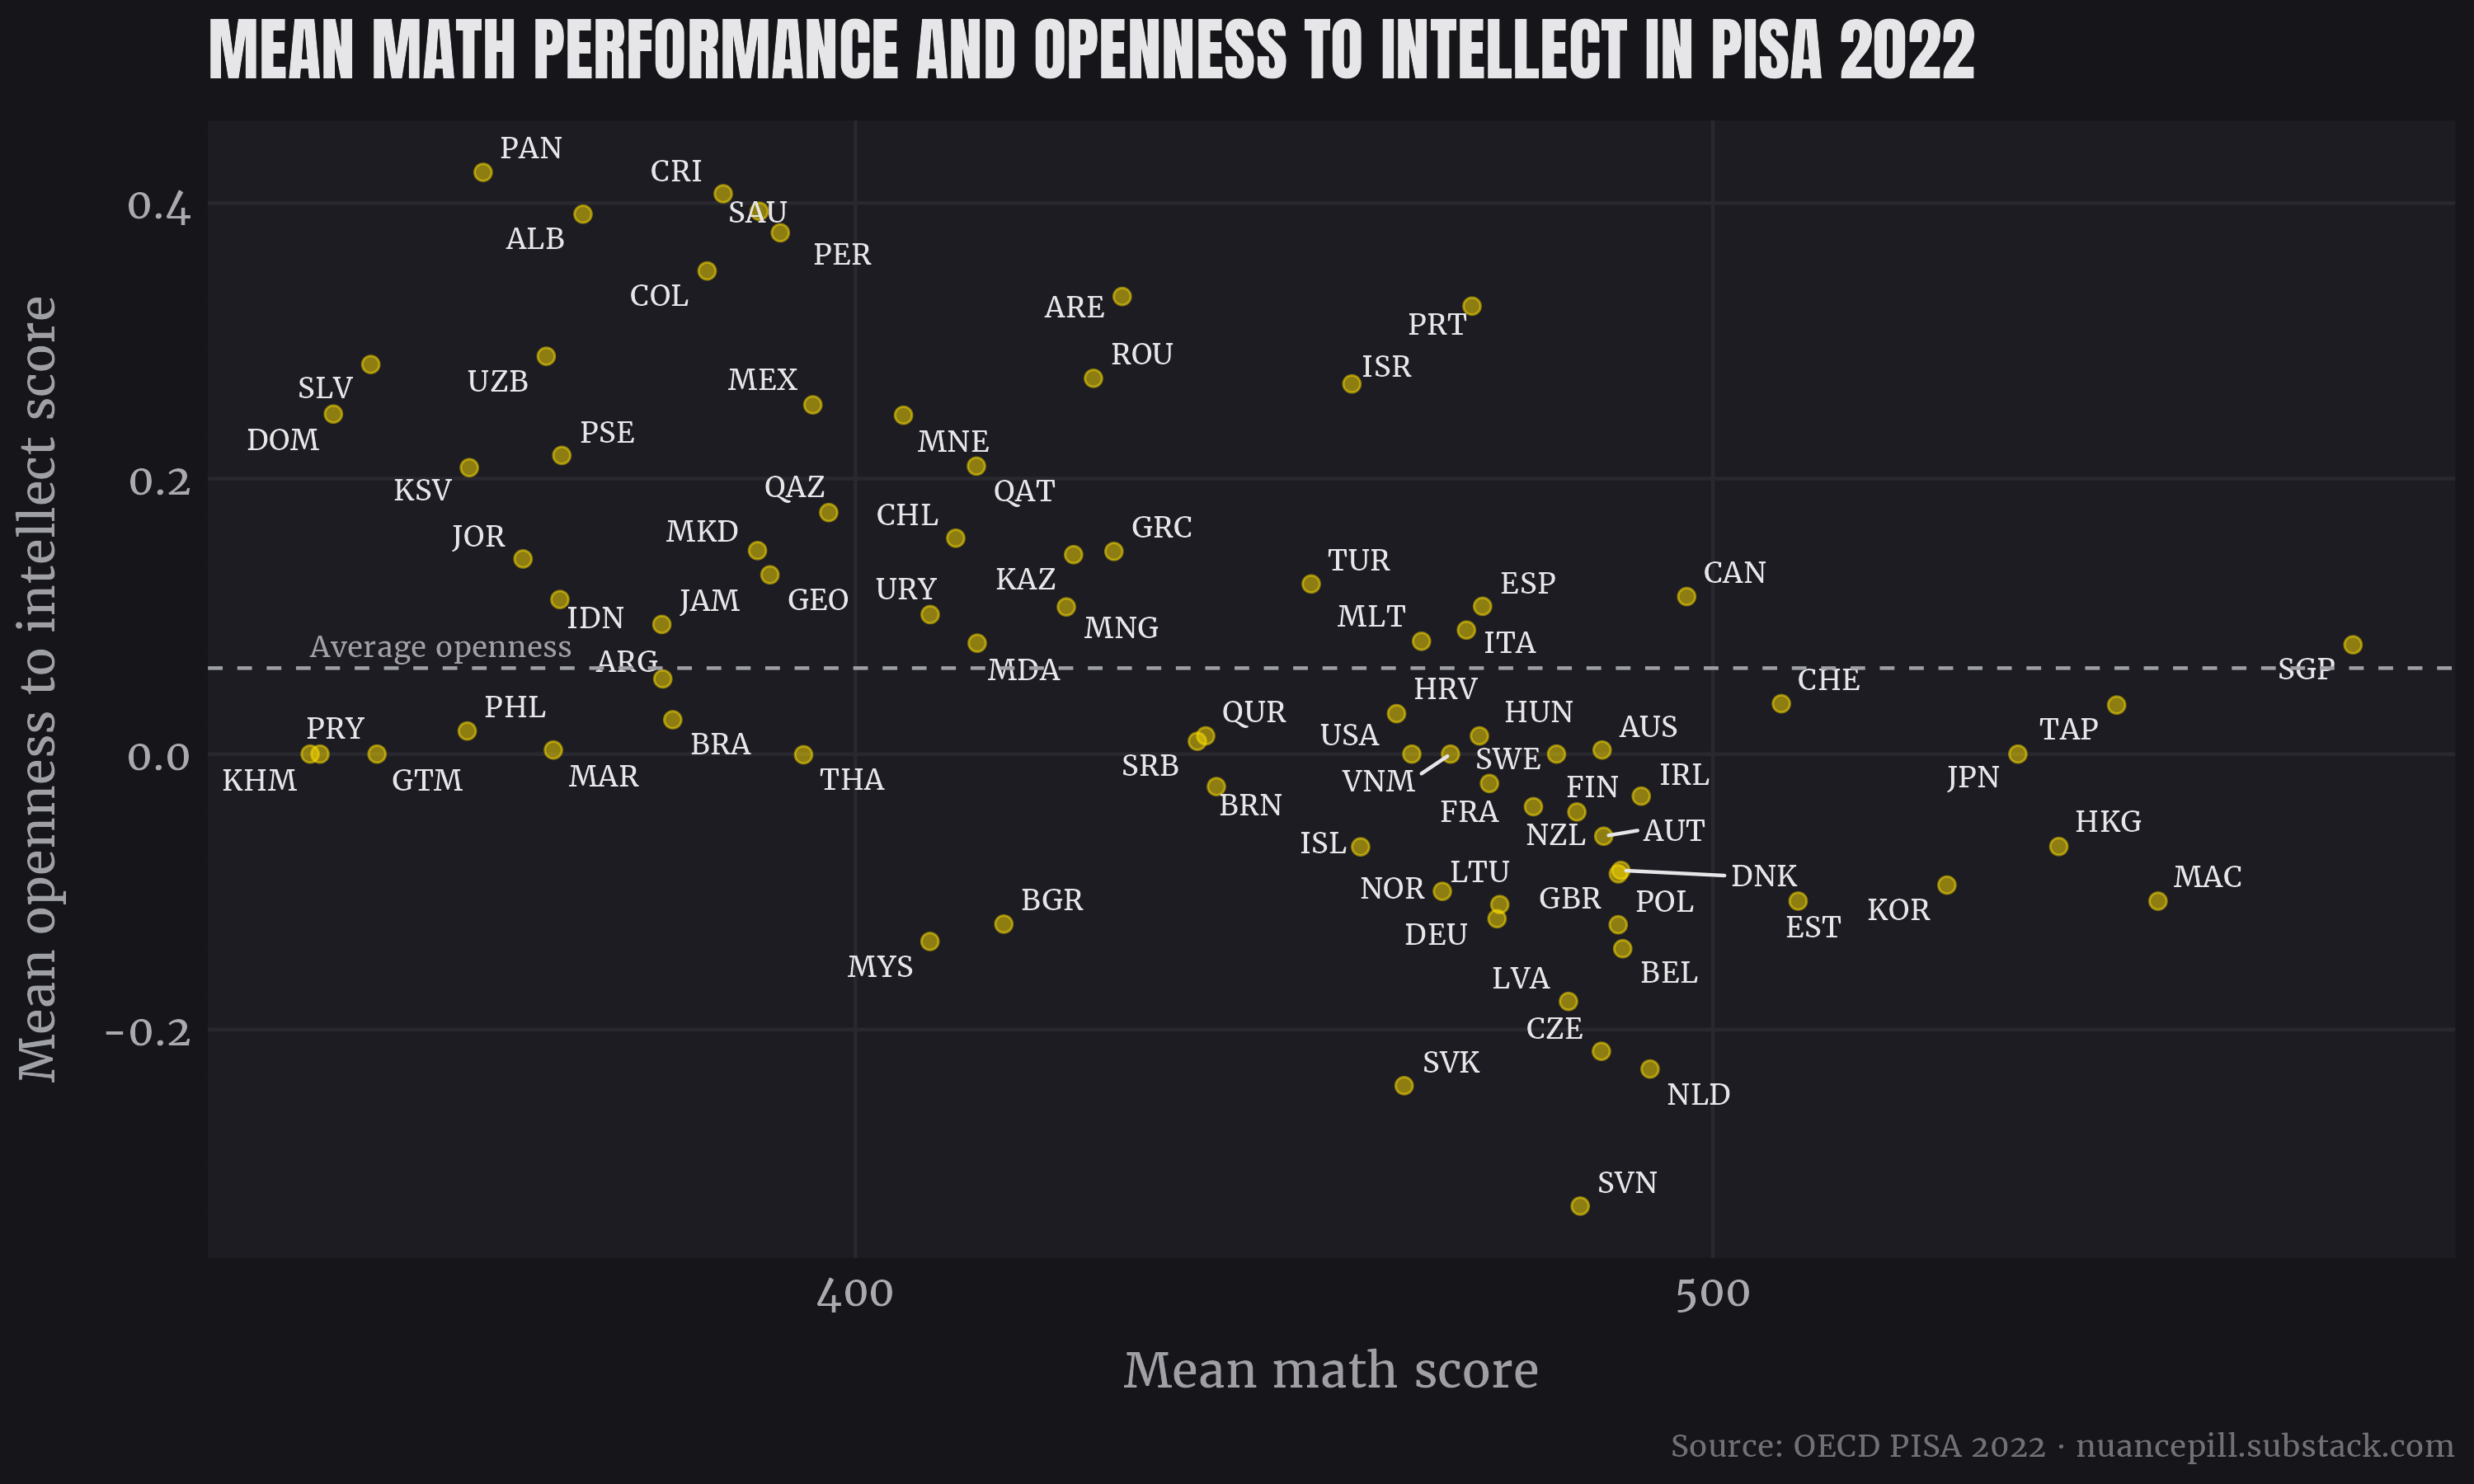
PISA also included questionnaires from which several indices were derived, including Creativity and Openness to Intellect. Students rated their agreement with statements such as ‘doing something creative satisfies me’, and ‘I like games that challenge my creativity’. With the exception of Singapore, East Asian countries fell below the average on this index – but so did most Western countries. While this index positively correlated with cognitive performance at the individual level, this was inverted at the national level.
These results should be interpreted with caution; cross-cultural personality comparisons are a sketchy business. One study compared behavioural and demographic predictors of conscientiousness with cross-national measures based on self-reports, peer reports, and perceptions of national character. These predictors correlated strongly with perceptions of national character, but failed to correlate with self-reports or peer-reports. This suggests the apparent gap reflects limitations in cross-national personality measurement more than inaccurate stereotypes.
One issue is that self-reports are anchored to local norms; what counts as an average level of extraversion in Brazil may differ from Finland. Social desirability bias may also vary across cultures depending on which traits are highly valued, as do response styles, such as a tendency toward extreme or modest responding. Finally, subtle differences in interpretation can arise during translation.
Within the US, Eap et al. (2008) found that Asian Americans11 scored higher in neuroticism (d = .42), and lower in openness to experience (d = −.40), extraversion (d = −.36), and conscientiousness (d = −.50). The most unexpected difference is again in conscientiousness. Asian Americans also scored higher in loss of face, or greater concern for social evaluation, and personality profiles showed greater congruence between European Americans and Asian Americans who were highly acculturated or had lower concern for losing face.
Other studies12 have reported similar personality differences that tend to be minimized with greater acculturation.13 Lui et al. (2019) found that Asian Americans14 scored higher than European Americans in neuroticism and lower in extraversion and agreeableness, with no difference observed in openness. A meta-analysis (which didn’t include any of the above studies) throws a spanner in the works, finding Asian Americans to be slightly higher in openness, as well as conscientiousness (though the latter was not significant).
The shortcomings of cross-cultural comparisons likely don’t fully vanish in subnational comparisons. East Asians may present themselves in a more modest light because self-effacement is socially valued and serves as an impression-management strategy in collectivist cultures. In support of this, one study found that modest Chinese participants exhibited low explicit self-esteem while maintaining high implicit-self esteem, whereas modesty showed no such decoupling among American participants.
Unfortunately, there is not really a satisfying payoff to this section. Since cross-national comparisons are shaky, subnational data remains inconsistent and also of questionable reliability, and counterintuitive findings like East Asians scoring low in conscientiousness show up, it’s difficult to draw any firm conclusions.
Cultural variation in collectivism
The terms ‘collectivist’ and ‘conformist’ frequently come up in descriptions of Asian societies. While individualistic cultures encourage autonomy and self-expression, collectivist ones prioritize group harmony and social cohesion. A stronger focus on individual goals in individualist societies may promote creativity. Supporting this, Espig et al. (2021) found that lower power distance, higher individualism, femininity, lower uncertainty avoidance, long-term orientation, and higher indulgence are associated with greater innovation, and Rossberger (2014) demonstrated that national cultural practices such as low uncertainty avoidance and in-group collectivism mediate the relationship between a country’s personality profile (openness to experience and agreeableness) and innovativeness.
Non-Western cultures tend to be characterized by more interdependent social orientations in which the self is defined primarily through relationships rather than as a separate entity. Variation exists in how this interdependence is maintained, with East Asian cultures emphasizing self-effacement – avoiding conflict, fitting in, accommodating others, and suppressing impulses perceived as socially disruptive.
Social psychologist Geert Hofstede developed the foundational Individualism-Collectivism (I-C) Index, which revealed substantial cultural distances between European and Northeast Asian countries. However, Akaliyski et al. (2025) introduced a revised index suggesting that Hofstede’s original measure systematically overstates both the individualism of Anglosphere countries and the collectivism of East Asian countries.15 At the same time, relative rankings didn’t move much. Japan ranked 20th out of 102 – just slightly below the US – while other East Asian countries were also above the global average. The highest scores continue to be concentrated in Northwestern European countries and British offshoots.
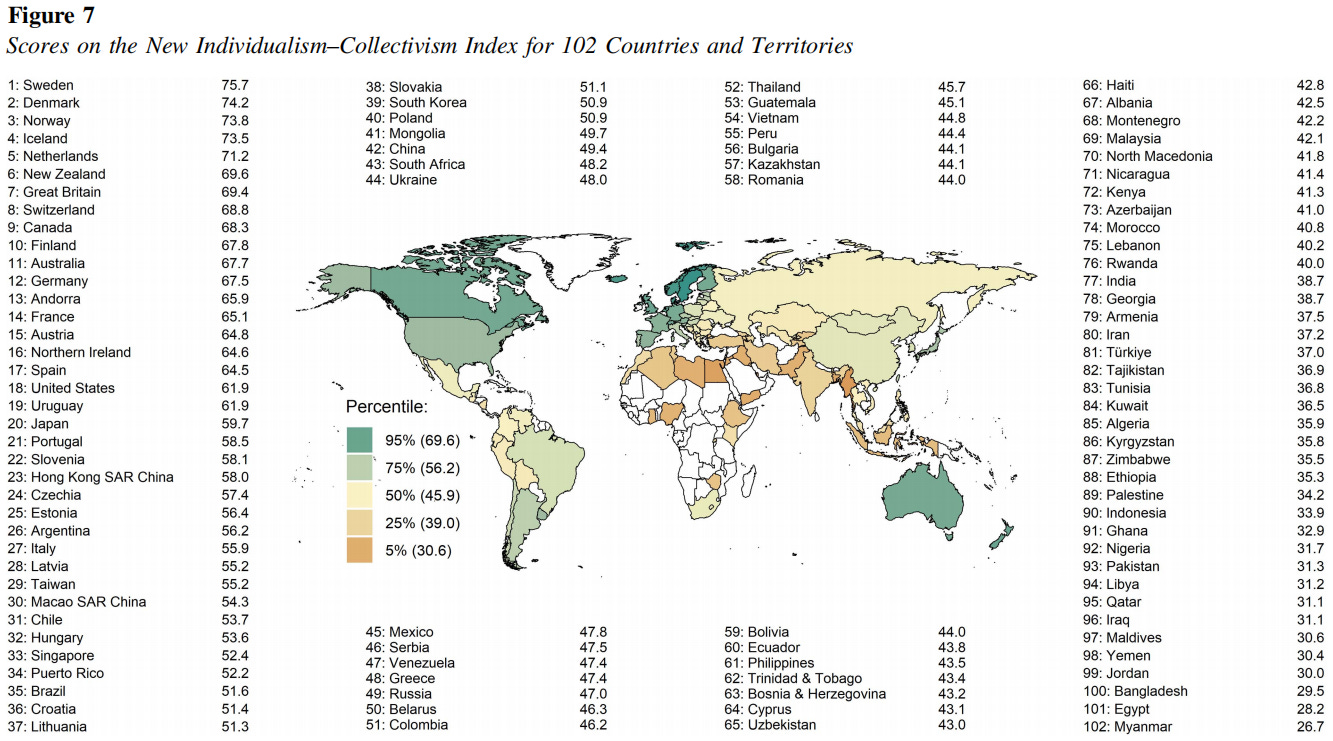
As well as the validity of the original scale, the authors question the representativeness of its sampling. The previously mentioned limitations of cross-cultural self-report measures should also be kept in mind. The explosive economic growth East Asian countries experienced in the latter half of the 20th century may have played a role in these shifts. Alongside improved sociopolitical conditions, Asian nations have seen a decline in collectivism, though without a corresponding rise in individualism.
East Asian cultures also exhibit lower relational mobility, meaning individuals have less freedom to choose social ties, which reinforces collectivist norms by raising the social costs of defection. Cultures also vary in how ‘culturally tight’ they are, or how strongly their social norms are enforced and deviant behaviour is punished. This dimension is moderately correlated with collectivism but appears to be conceptually distinct. Cultural tightness has been negatively linked to national innovativeness. As the US has grown looser over time, it has gotten more creative,16 but at the expense of reduced social order.
Origins of collectivism variation

What explains these patterns? Many attribute East Asian collectivism to the long shadow of Confucianism, a conservative tradition that subordinates the individual to the collective. As the story goes, this philosophy emerged amidst the intense political strife of China’s Warring States period, when the Zhou dynasty lost its central authority and rival states competed to fill the power vacuum; by enforcing strict adherence to social norms and hierarchy, Confucianism helped restore social order. One study showed that Chinese counties with stronger Confucian norms17 experienced significantly fewer peasant rebellions following crop failures. While it would be an exaggeration to suggest that Confucianism opposes intellectual exploration altogether, it remains less interested in abstraction or challenging the status quo and more in moral cultivation and practical wisdom.
Pathogen-stress theory proposes that collectivistic behaviours like conformity and ingroup preference serve a defense function, reducing disease transmission in regions with high pathogen prevalence; in lower-prevalence regions, populations are less penalized for openness and exploration. Consistent with this account, historically high pathogen prevalence predicts higher collectivism and lower individualism, and lower openness, extraversion, and sociosexuality. Cross-nationally, individualism correlates positively with COVID prevalence, mortality, and case fatality, whereas collectivism shows the opposite pattern. Relational mobility similarly predicts faster viral spread. To what extent these patterns stem from natural selection remains up for debate. Some evidence for non-genetic transmission comes from comparisons of former East and West German districts, as well as from before and after the outbreak, where higher case numbers were associated with a rise in collectivism (but not reduced individualism).
Climatic stability may have also played a role. Van de Vliert et al. (2025) show that Chinese residents are more collectivistic and less individualistic than European residents, arguing that this is better explained by ecological differences across latitudes rather than an east-west longitudinal gradient. Greater climatic stability may increase the relative benefits of group coordination and routine-based behaviour, whereas more unstable environments favour flexible responses. In the latter, individual learning becomes necessary; while blindly copying existing behavioural templates is more efficient, it becomes maladaptive under turbulent conditions.
Another prominent theory revolves around rice farming, which requires coordinated irrigation and synchronized planting, thus intensifying mutual dependence. Alone, interdependence may not be enough – there may also need to be a conflict of interest. Shared resources create an incentive to free ride, especially when cooperation is costly; this creates instability that collectivist norms are suitable for solving. Historically, rice-farming societies have been associated with tighter social norms both within China and elsewhere, and the rice-growing regions of southern China are more interdependent and holistic-thinking than the wheat-growing north. Comparing neighbouring counties along China’s rice-wheat border, one study found that rice-growing regions were less individualistic, more loyal to friends, and more relational in their thinking. Another found that people in Chinese regions with a history of farming rice wore masks during the COVID outbreak more often than those in wheat regions. This hypothesis has faced criticism, and a recent study failed to show evidence that historical rice farming predicts modern psychological differences in Japan.
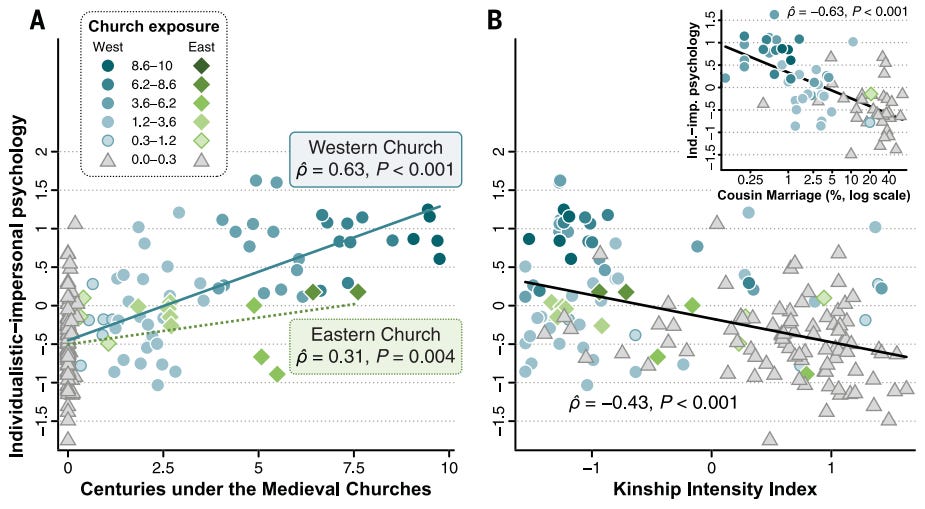
Because the West is more individualist relative to the global baseline than the East is collectivist, trying to explain East Asia’s collectivism may be asking the wrong question. It has been argued that the West’s unusual individualism is a byproduct of the medieval Catholic Church’s restrictions on cousin marriage. By weakening extended kinship networks, these bans forced people to rely more on voluntary associations and impersonal, rule-based institutions, ultimately paving the way for uniquely individualistic ‘WEIRD’ cultures. Evidence for this comes from the fact that longer Western Church exposure is associated with less cousin marriage, more individualism, higher trust of strangers, etc., mediated primarily by kinship intensity. On the flipside, Ji et al. (2026) find that individual engagement in Chinese clan practices is positively associated with collectivism. At the regional level, greater road distances from Beijing predicted stronger clan institutions, which in turn mediated regional variation in individualism-collectivism.
Genes and culture
A contentious issue is how ingrained these cultural differences are. While personality traits are substantially heritable, this variance refers to differences between individuals within populations. Substantial environmental effects can shift the baseline level of a trait across a population while leaving little effect on within-population variation. To cope with increasingly complex social systems, human evolution likely favoured highly socially adaptive brains. Cultural learning allows for vastly quicker adaptation to environmental changes than genetic selection. This still leaves room for important genetic differences that inform behaviour. Through gene-culture coevolution, cultural environments can set the stage for genetic selection, while genetic predispositions simultaneously influence the transmission and expression of cultural traits in a feedback loop.
Many genes show accelerated selection over the past 10,000 years, which may indicate culture’s evolutionary effect. A prominent example is the emergence of lactase persistence mutations. These variants are heavily concentrated in Northern Europe and among pastoralist populations in Africa and the Middle East, where milk consumption created a strong selection pressure. The spread of these genes would then perpetuate pastoral traditions. Likewise, a variant associated with reduced alcohol tolerance and facial flushing18 likely emerged around 8,000 years ago in the rice farming regions of southern China, possibly because it discouraged heavy drinking in highly interdependent agricultural communities. One study found a relationship between the percentage of land devoted to paddy rice and the regional frequency of the gene variant for alcohol intolerance.
An influential study by Chiao & Blizinsky (2010) showed that collectivist cultures had higher frequencies of the short (S) allele of the serotonin transporter gene (5-HTTLPR), a variant associated with increased stress sensitivity. Further, they found that cultural values and S-allele frequency negatively predicted the global prevalence of anxiety and mood disorders; this relationship was mediated by collectivist values, suggesting that cultural collectivism may buffer genetically susceptible populations. This paper has faced criticism; the observed correlation may simply reflect neutral migratory history and gene flow. A meta-analysis found no evidence that 5-HTTLPR predicted depression, either directly or via an interaction between life stress, and a GWAS study also found no association between 5-HTTLPR and any neurobehavioral traits.
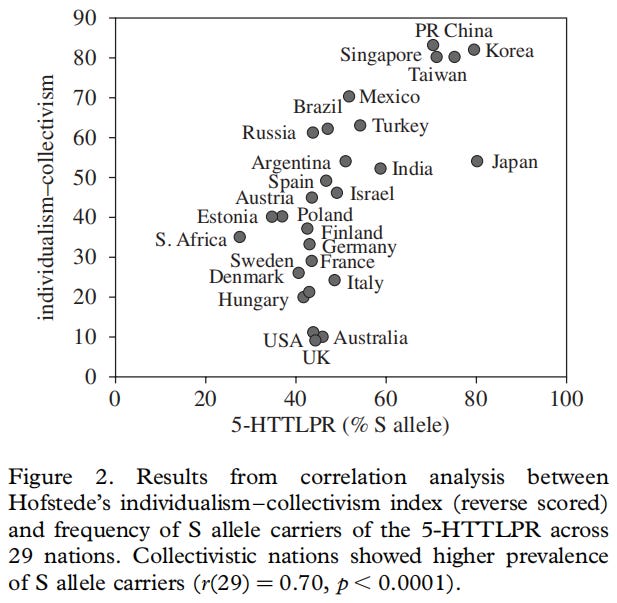
Adding to these critiques, Minkov et al. (2014) found that S-allele prevalence isn’t associated with individualism but instead with traits such as national neuroticism, IQ and school achievement, and long-term orientation. They point out that the lowest global prevalence of the S-allele is found in sub-Saharan Africa – not a region that screams individualism. With this in mind, treat the following studies tentatively.
Another polymorphism within the serotonin transporter gene, STin2, ranges in frequency from 26% in Germany to 85% in Singapore. Examining this variant alongside 5-HTTLPR, Marcus & Cetin (2023) found that these polymorphisms explained 23.6% of the unique variance in monumentalism between societies, but none in individualism. Way & Lieberman (2010) extended these findings to two genes associated with stress reactivity and social sensitivity: MAOA and OPRM1. They reported that the national prevalence of these alleles was negatively associated with the lifetime prevalence of major depression, an effect partially mediated by collectivism.
Lee et al. (2022) went a step further, examining how genetic variants alter actual gene expression in the brain. They discovered that expression of the oxytocin receptor gene (OXTR) within the anterior cingulate cortex (ACC) – a brain region involved in social error detection and norm compliance – is highly variable across the world, and closely tracks cultural tightness and historical socioecological threats. Their models suggest a dual feedback loop: high socioecological threats and tight cultural norms select for genetic variants that enhance oxytocin expression in the ACC. In turn, people with these variants are more sensitive to social feedback, rendering them more likely to successfully transmit and enforce strict social norms. Genetic scans seemed to confirm that these variants have undergone positive selection within the culturally tight social structures of East Asian populations.
Dopamine-regulating genes have also been studied as candidates. While the 7-repeat allele of the dopamine D4 receptor (DRD4) gene has a global frequency of about 20%, it is found in only 2% of East and South Asians; one study found a frequency of less than 0.5% for all alleles above six repeats in a Chinese sample. This gene has been linked to novelty seeking and impulsivity via heightened reward sensitivity. Carriers also show greater phenotypic plasticity, rendering them more sensitive to environmental conditions. For instance, Kitayama et al. (2014) demonstrated that while European Americans view themselves as more independent and Asian-born Asians as more interdependent, this difference was restricted to carriers of the 7- or 2-repeat alleles. Another study found similar patterns in brain structure, with East Asian carriers displaying increased grey matter volume in regions associated with perspective-taking and mind-reading, consistent with a more interdependent orientation. Similarly, Yu et al. (2019) showed that differences in grey matter volume in regions associated with self-focused processing and social evaluation appeared more strongly in carriers. The length of time spent in the US also predicted increased grey matter volume. Japanese carriers show stronger neural responses to norm violations, an effect absent in European Americans.
So a function of genes may be to facilitate the transmission of culture, though this wouldn’t account for the origins of the cultural differences themselves. Genes may play a role in shaping culture, just as culture and the ecology it responds to can influence the genetic makeup of populations. The strength of these effects and how well these findings replicate remains to be seen. Many single-gene effects on complex traits have fallen victim to the replication crisis and haven’t held up to genome-wide association studies, which have shown that psychological traits are highly polygenic and influenced by thousands of small genetic variants. Even the most prominent candidate genes tend to explain a minuscule amount of variance in personality or behavioral traits, and common variants never have strong effect sizes. There are monogenic or Mendelian traits such as colour blindness or sickle-cell disease where a single mutation is fully responsible for the condition, but complex human behaviour and cultural traits like individualism don’t have single genetic switches.
Culture moves faster than genes. There’s no shortage of historical examples of rapid societal transitions from one ideology or system to another. To take an obscure example, Germany’s transition from Weimar to Reich wasn’t driven by a sudden influx of Hitler genes, just as hippie genes didn’t cause the 1960s counterculture movement. There is evidence that the Nazi regime had a lasting effect on the views of those who grew up under it. People also frequently point to the Korean Peninsula divide as a case study for the importance of institutions. I don’t know exactly where North Korea falls on the I-C index, but I’m guessing K-pop ranks higher than Juche – though to be fair South Korea didn’t rank much higher than China. Regardless, shared genes don’t guarantee shared culture.
You could argue that when countries like Japan Westernize, they import cultural memes that ultimately originate in Western genes. Even if we accept that framing, it arguably still counts as an ‘environmental’ influence for Japan. You can imagine a similar process within a country, where a subpopulation with a distinct distribution of traits has outsized cultural influence beyond any aggregate genetic effects on culture. The controversial ‘spiteful mutant’ hypothesis rests on this logic. It also blames the Industrial Revolution, so you could argue its ultimate cause is environmental – though of course you could also argue this can’t be separated from the genes of the underlying population. Often there may be no clean separation.
As noted earlier, East Asian countries have tended to become more individualistic over time. Inglehart’s postmaterialism thesis argues that as societies become more economically secure, younger cohorts shift from prioritizing material security towards ‘postmaterialist’ values such as autonomy, self-expression, and quality of life. The inverse relationship between democracy and support for strong leaders is largely driven by material concerns. While it’s not an iron law, economic development is a strong predictor of shifts towards liberalization and democratization, and younger cohorts typically endorse more postmaterialist values.
Japan’s Nobel Boom and China’s lag
With all that said, Japan in particular is far from a creative desert. Beyond anime and video games, it has led in robotics, automotive engineering, and consumer electronics. Nobel Prize stats were mentioned earlier, but they obscure recent trends. Since 2000, Japan has mostly caught up to the UK. In 2001, the Japanese government announced a goal to bring home 30 Nobel prizes over a 50-year period, and at current rates they’re on track to succeed.
I tallied the Nobel laureates in the hard sciences from 2000 to the present: 25 of 202 (12.4%) were of East Asian descent. The vast majority (88%) were Japanese, while the remaining three were Chinese. Adjusting for population size only makes this disparity starker, with the Japanese winning Nobel Prizes at about 80 times the rate. People of European descent account for around six times as many Nobel laureates as Japanese people, while outnumbering them by about nine to one in the global population. This implies that the Japanese are if anything slightly outperforming the broader European population now – though Europeans aren’t a homogeneous group, and several countries still outperform Japan.
Why might Japan be dominating China so overwhelmingly? It seems unlikely that relatively minor genetic differences could carry much weight. It’s worth remembering that Japan scored significantly higher in individualism. A high-stakes exam-based education system might fuel competition, but its rigid focus on rote learning can overselect for test optimization rather than genuine curiosity. Academic incentives are often distorted by pressures around publication metrics and monetary rewards. Fierce competition for grants and tenure creates a breeding ground for ‘paper mills’ that churn out bad or fake research. These issues are by no means unique to China, but have been said to be especially prevalent there.
Only 3 of 22 Japanese laureates since 2000 earned their PhDs from Western universities (compared to 2 of 3 Chinese laureates), meaning Western training is unlikely to explain the gap, though Japan may have benefitted from closer ties to Western academic networks.
There’s also a time lag to consider: Nobels typically come decades after discoveries are made, after they’ve been independently replicated and recognized as foundational. Japan industrialized decades before China, giving it a big head start in R&D investment – China only caught up to Japan’s total research spending in 2009. The Cultural Revolution also set academic progress back: universities were shut down and ‘bourgeois’ intellectuals were purged until Deng Xiaoping’s reforms.
The tides may be shifting. China recently overtook the US in total R&D spending, though the US still leads in basic or fundamental research, where it spends 0.5% of its GDP compared to China’s 0.19%. Applied research tends to generate stronger short-term returns but fewer foundational breakthroughs. This gap may be closing, as China has been steadily increasing the share of resources allocated to basic research while the US remains stagnant.
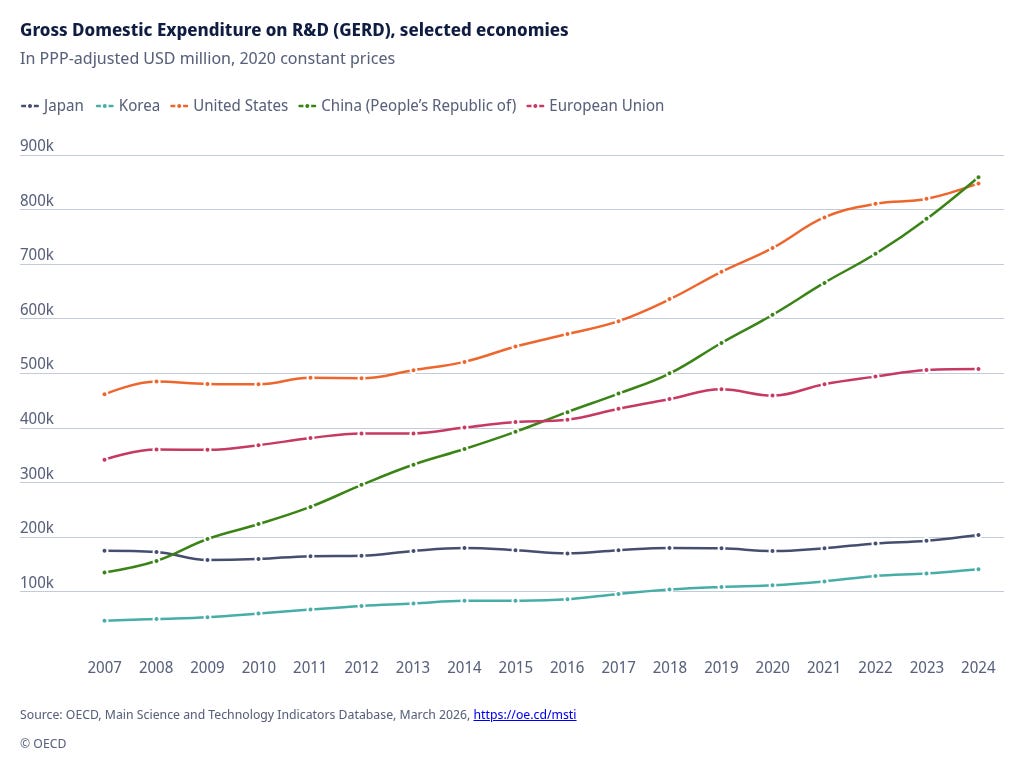

China has also taken the lead in the volume of publications in elite journals, which weakens the charge that its output is driven solely by quantity over quality. Japan and South Korea are also showing larger output growth than Western countries. China ranks second globally in raw citation count, but also exhibits the greatest ‘home bias’ in citations, dropping to fourth place after adjusting for this.
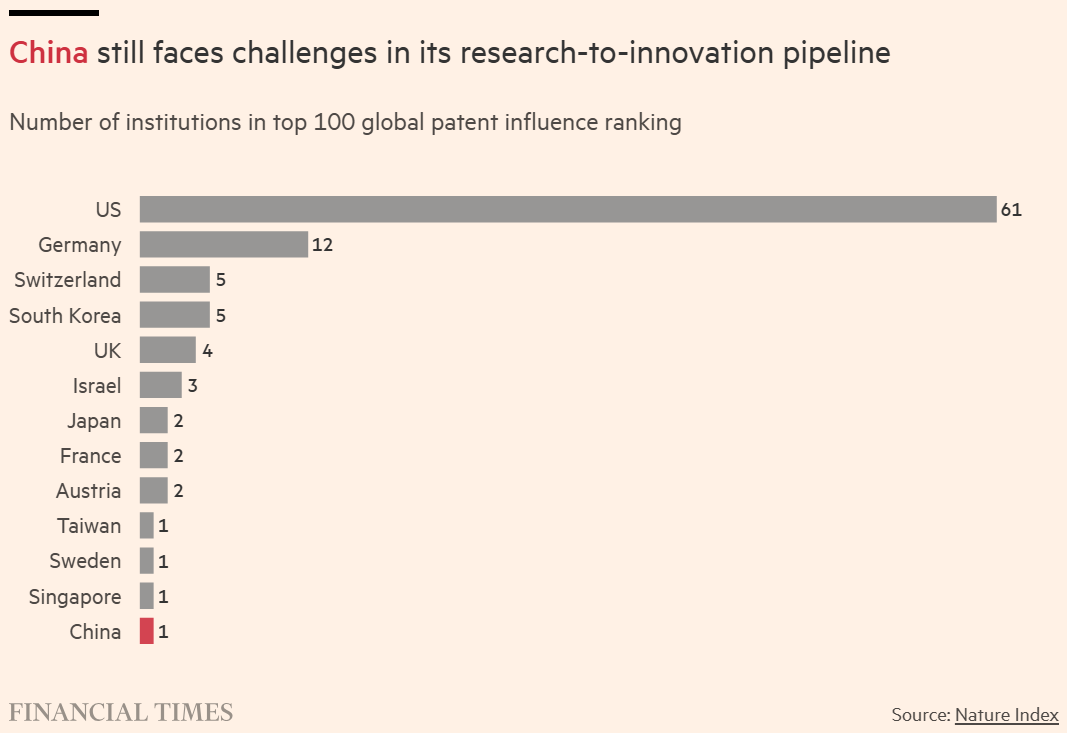
It remains to be seen whether China is able to lead the way rather than continue to rely on copying and pasting. The 2021 patent influence rankings illustrate China’s struggle to catch up in quality, though like Nobels, it takes time for patents to be issued and cited, so this dataset may largely measure Chinese innovation from 2010 or earlier. China now files about half of all patents worldwide, but a large number are junk patents designed to hit quotas and collect subsidies. The Chinese government has made efforts to address this by axing subsidies and pushing for high-value patents.
To be fair, with the low hanging fruit already picked, China will have a hard time matching the West’s run even assuming equal creative capacity. China has reportedly made strides in quantum technology and AI, though OpenAI and Anthropic have accused DeepSeek of distilling their models, so how much of its progress reflects genuine innovation remains anyone’s guess.
It has been claimed that Chinese innovation peaked during periods of political fragmentation and declined under imperial consolidation. While China has been largely centralized since the Qin dynasty unified rival kingdoms in 221 BC, Europe remained an arena of competing states. The Song Dynasty may seem to challenge this argument, as despite being a unified imperial state, it was a period of exceptional innovation – but it also faced existential threats from northern empires that would eventually conquer it. Most inventions and discoveries don’t emerge from lone geniuses having eureka moments; they often emerge from states mobilizing resources under pressure, as with the Cold War environment that birthed the internet and GPS. It’s entirely possible that rivalry with America will recreate these pressure cooker conditions, giving China the push it needs.
A nation of 1.4 billion people with an average IQ of 105 and normal variance would have 67 million people with an IQ of 130 or above, which could well represent most of the planet’s total supply. The majority of this population has only recently been lifted out of extreme poverty. Now that basic survival needs are secured and they can reach their cognitive potential, there is a vast pool of human capital ready to be channelled towards innovation. Even if differences in creative potential exist, it’s hard to imagine that they’re large enough that 67 million 130+ IQ individuals are doomed to remain an army of engineers who can’t come up with anything new, and even without especially strong novelty-seeking tendencies, a top-down mandate may be able to push them to invent – even if it’s just to more efficiently crack down on Winnie the Pooh jokes.
Unlike for men and women, there’s no obvious theoretical reason to assume a different distribution (that I’m aware of). The only somewhat plausible mechanism is the systematic culling of outliers. There were anti-intellectual purges during the Cultural Revolution and most famously Cambodia’s executions of glasses-wearers, but these campaigns haven’t been uniquely Asian, nor likely sustained enough to strongly affect the East Asian gene pool, and wouldn’t be counterbalanced by the systematic killing of low IQ individuals, so they would truncate the distribution and lower the average IQ rather than simply narrow it. Alternatively, one could argue that society rewarded people near the mean who were best able to conform, granting them higher status and reproductive success (i.e. stabilizing selection). But there’s no reason to think intelligent people couldn’t recognize the rules of a conformist society and play the game to achieve high status; in fact, China’s Imperial Examinations explicitly rewarded smart conformists. Also, witches and heretics will inform you that pre-Enlightenment Europe wasn’t exactly a haven of free thought.
Paper, printing, gunpowder, and the compass.
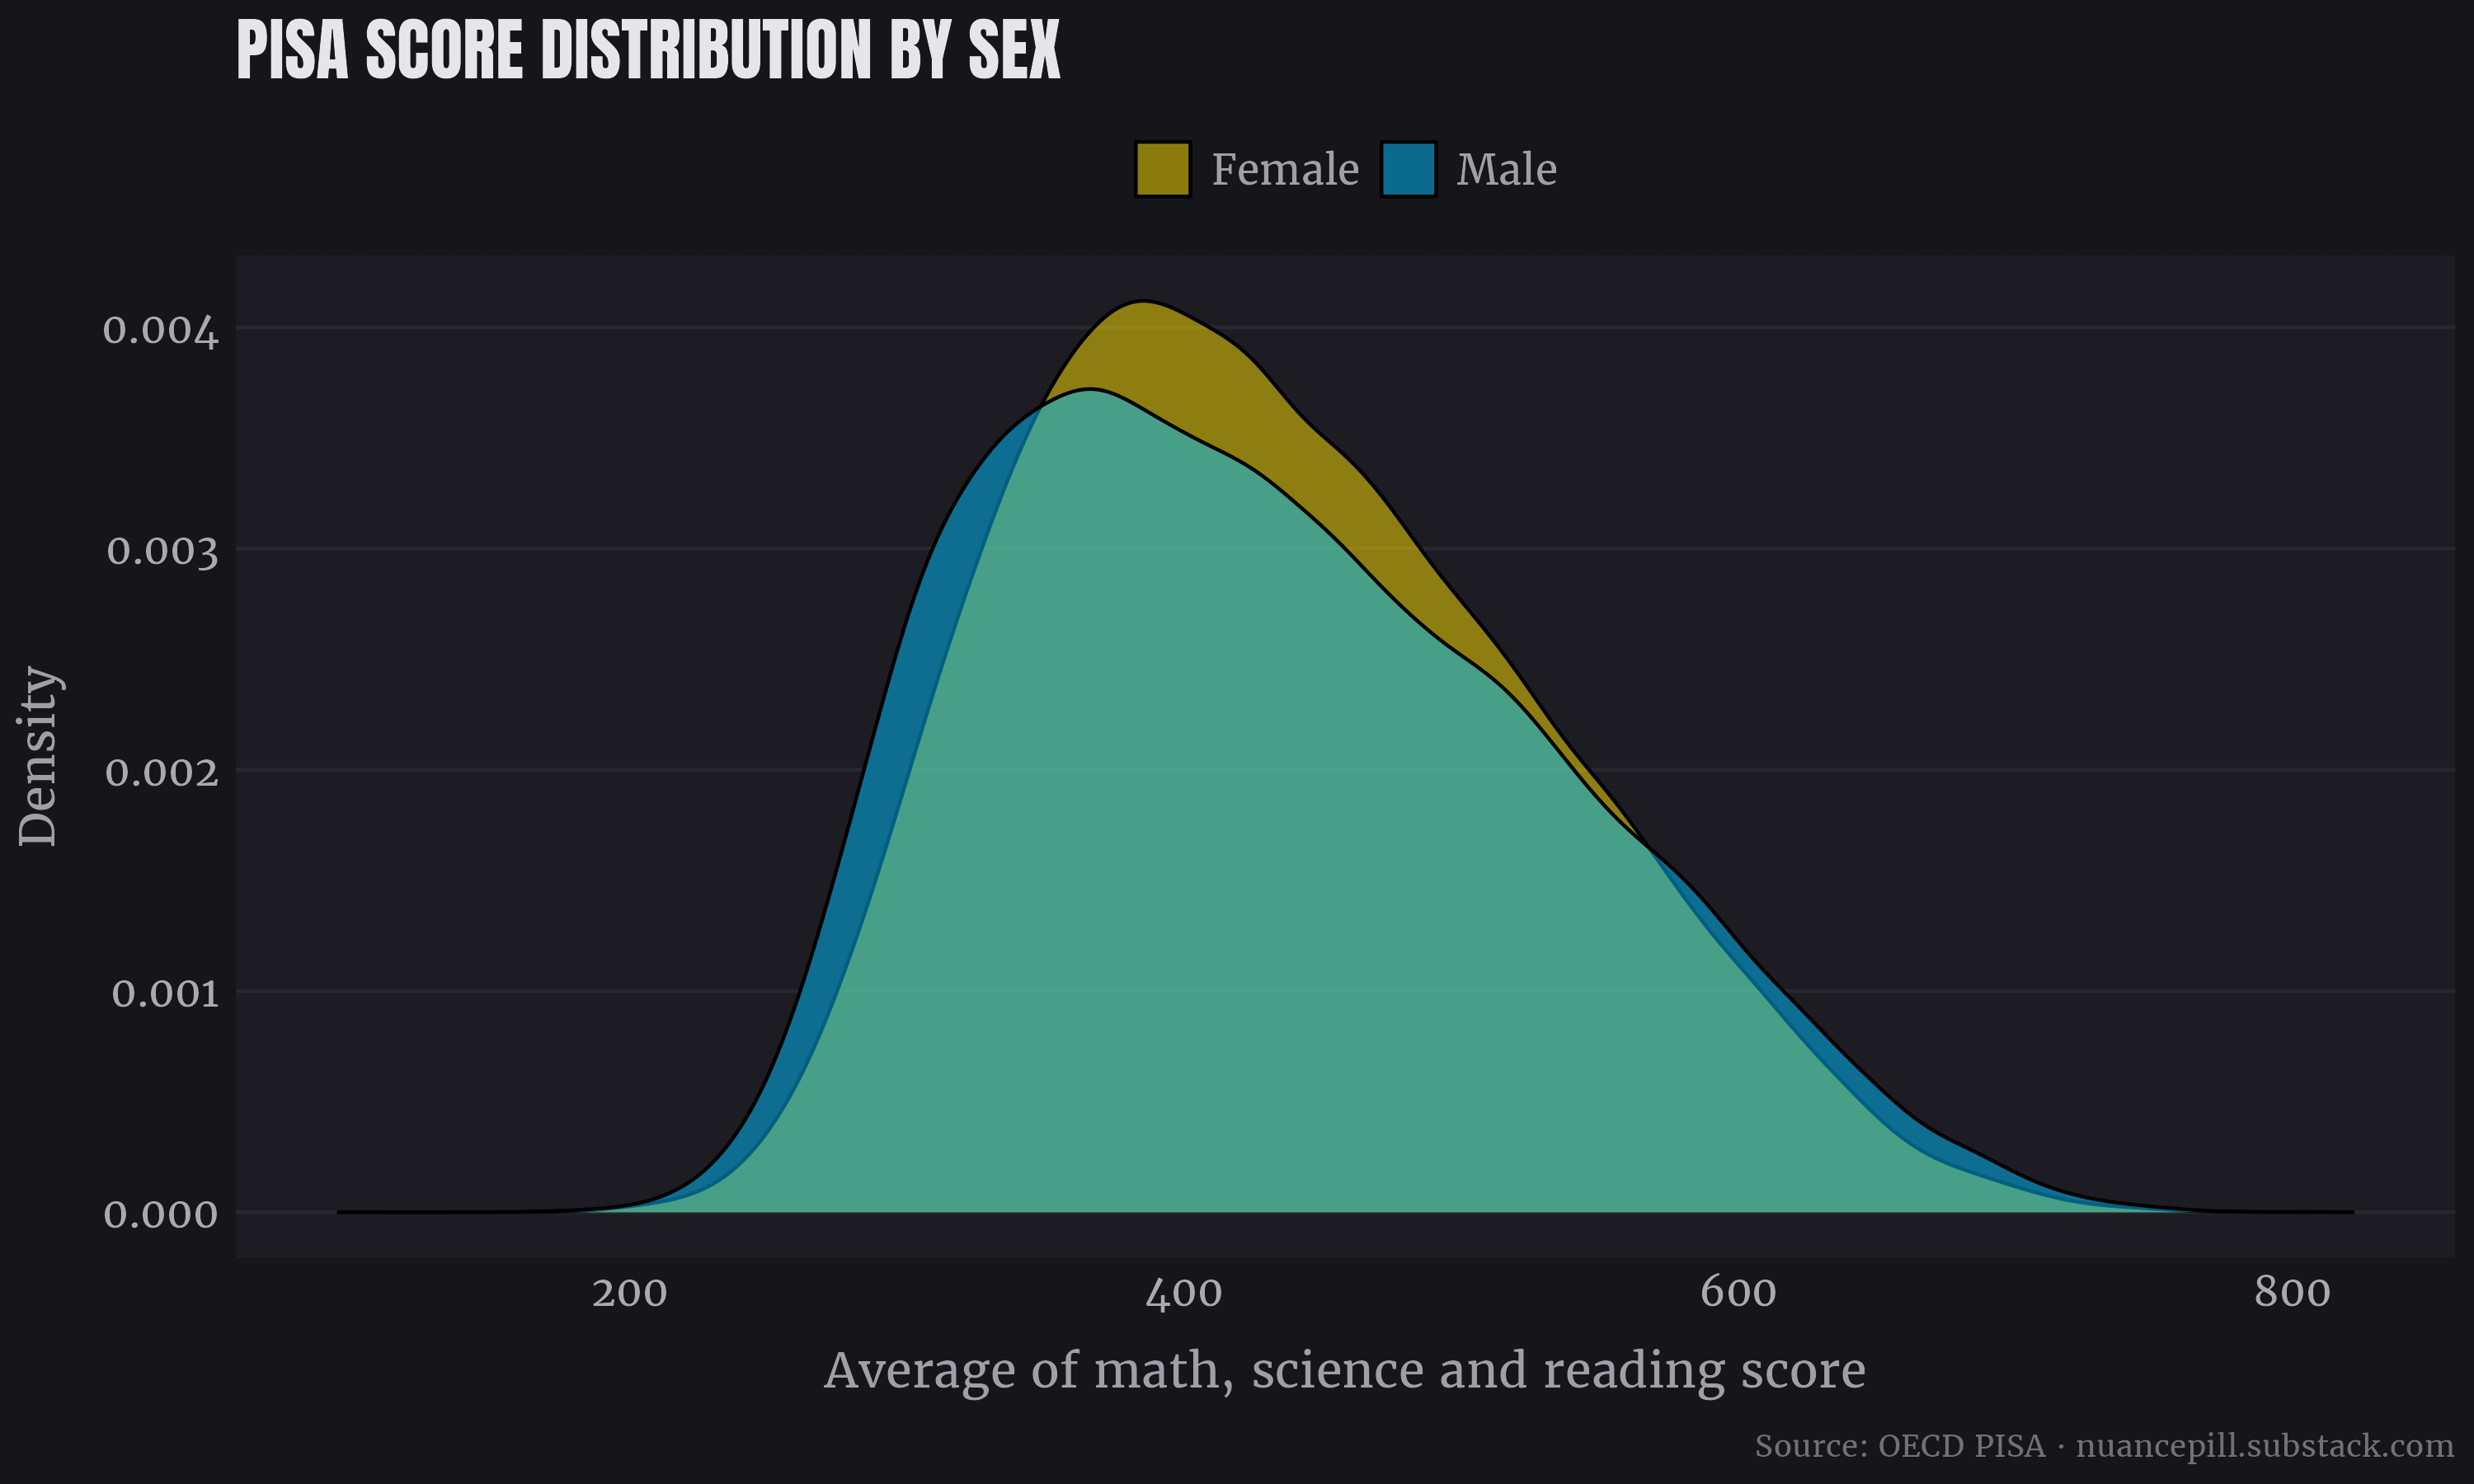
Mainland China’s results weren’t published due to incomplete data collection. China’s data is also not nationally representative since only the four provinces/municipalities of Beijing, Shanghai, Jiangsu, and Zhejiang are covered. There has also been suspicion raised about shady practices.
A common concern is that immigrants depress average scores in Western nations. Excluding first- and second-generation migrants has only a modest effect, with the biggest shift seen in Germany at around 20 points. The impact on SD, which is the main focus here, is also minimal. The IMMIG variable seems to have substantial missing values, including for the whole Japan sample. It might be possible to reconstruct the variable, but it would be more effort than it’s worth.
Estonia, Ireland, Czechia, Poland, Australia, and Switzerland.
This isn’t likely due to language differences, as tests are administered in students’ language of instruction.
However, ‘A sufficient level of processing speed was necessary for achieving high divergent-exploratory thinking scores, while minimum levels of Total IQ or fluid reasoning were required for convergent-integrative thinking’.
Such as composing a piece of music, making a scientific discovery, or writing a book.
Data for Japan was apparently unavailable.
26.5% Chinese; 14.3% Japanese; 10.3% Filipino; 10.3% Korean; 8.4% Vietnamese; 30% mixed or other Asian American.
Though unidimensional measures of acculturation have been criticized.
Largest ethnic groups included 179 Chinese, 77 Indian, 50 Korean, 27 Vietnamese.
Neither scale is likely perfect; the updated one may have placed too much weight on measuring liberal values rather than individualism itself.
Measured by registered patents, trademarks, feature films produced, and baby-name diversity.
Proxied by the density of Confucian temples and chaste women monuments.
The Asian flush.
"not a region that screams individualism." - While I agree Africa is not known as a land of rugged individual entrepreneurs or "go out at 18 to make your own future", on aggregate Africans do seem to have a notable personal sense of individual distinction in personality and social relations/dynamics. Think of manner of dress, humor, and other such things. Given the worldwide population of East Asians and Africans, it's unexpected that more solo African music stars are known globally than East Asian ones( I am aware including African-Americans here is confounded by the fact they sing in English, but still).
I know this has nothing to do with this post
But the other Day i found strong evidence debunking some common red pill and Black pill and evopsycobros assertions